Introduction
For the past few years, "Manhattan office market" and "uncertainty" appeared in the same sentence with exhausting regularity. That narrative has shifted.
By the end of 2025, Manhattan's office market posted its highest annual leasing volume since 2019. That's not a statistical anomaly driven by a handful of mega-deals — it reflects genuine demand recovery across the board. Availability has tightened for seven consecutive quarters. Sublease supply has fallen to its lowest level in six years. Companies signing leases aren't just renewing out of obligation; many are taking new space and actively expanding.
For high-growth companies, Series A–C startups, and enterprise tenants evaluating Manhattan office space, this matters. The window to secure quality space at current rents and current negotiating leverage is narrowing. Understanding where the market actually stands — the data, the neighborhoods, the forces driving demand, and the timing — is the difference between a well-positioned lease and an expensive mistake.
What follows is a breakdown of the key numbers and neighborhood-level shifts that should inform any real estate decision you're making this year.
Key Takeaways
- Manhattan's 2025 leasing volume hit 41.92M SF — the highest annual total since 2019
- Availability has tightened for seven consecutive quarters, with sublease supply at its lowest since late 2019
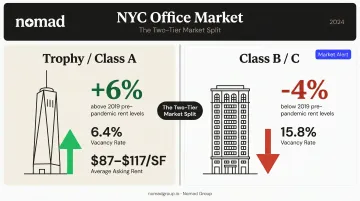
- Trophy and Class A space leads the recovery; Class B vacancy remains stubbornly high, marking a clear two-tier market split
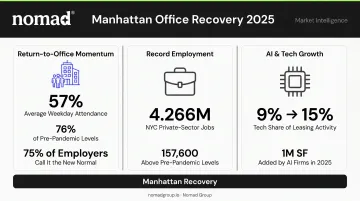
- Tech and AI companies have emerged as a meaningful demand driver, with tech's share of Manhattan leasing rising from 9% to nearly 15% year-over-year
- New and expansion leases are growing as a share of activity, reflecting genuine occupancy confidence rather than routine lease renewals
Manhattan Office Market 2025: A Year of Meaningful Recovery
Leasing Volume and Availability
According to Colliers' Q4 2025 Manhattan office market report, Manhattan recorded 41.92M SF of office leasing in 2025 — the strongest yearly total since 2019's 42.97M SF. Q4 alone contributed 11.87M SF, up more than 25% from Q3.
Availability has followed. Colliers put Q4 2025 Manhattan availability at 13.9%, down 0.7 percentage points from September and the seventh consecutive quarter of stable or tightening conditions. Manhattan availability peaked at 20.0% in Q2 2023, according to Avison Young — meaning the market has pulled back roughly 500 basis points from that high-water mark.
Net Absorption and Asking Rents
Positive net absorption — actual space being occupied, not just leased — confirms that demand is translating into real utilization. CBRE reported +13.60M SF of net absorption for full-year 2025 and +4.70M SF in Q4 alone. Colliers reported +3.96M SF for Q4. Regardless of methodology, the direction is consistent: space is being absorbed.
That absorption is pushing rents higher — modestly. Colliers reported a Q4 average asking rent of $76.00/SF, the highest since October 2020, while CBRE put the figure at $77.89/SF, up 1% year-over-year.
The rent story is bifurcated, though. Per NYC Comptroller data using CoStar figures:
| Tier | Rent vs. Pre-Pandemic |
|---|---|
| Five-star / Class A | +6% above 2019 levels |
| Class B/C | −4% below 2019 levels |
The overall market average remains below pre-pandemic in real terms — an important nuance for tenants benchmarking today's costs against 2019.
Manhattan vs. the National Picture
Manhattan's CBD recovery has outpaced many of its national peers in both level and trend, according to NYC Comptroller analysis. The quality divergence driving that outperformance is the defining structural feature of today's market: a K-shaped recovery where premium assets are tightening fast while lower-tier buildings continue to lag.
Trend 1: The Flight to Quality Is Reshaping Manhattan's Office Market
The Two-Market Reality
The vacancy spread between asset classes tells the story bluntly. JLL data, cited by the New York Real Estate Journal, puts Manhattan trophy vacancy at 6.4% versus 15.8% for Class B — a gap of nearly 10 percentage points.
Class A space is being absorbed at an average pace of 2.1M SF per quarter over the trailing five quarters, per Colliers. Cushman & Wakefield reported 24.1M SF of Class A new leasing in 2025, the second-highest total in 30 years and just below 2019's peak.
On the rent side, Avison Young reported trophy base rents at $117/SF and Class A at $87/SF by late 2025 — a premium that reflects both scarcity and genuine demand quality differences.
What Tenants Are Prioritizing
Companies returning to or expanding in the office aren't just looking for square footage. Based on Nomad Group's on-the-ground work with high-growth companies in neighborhoods like Flatiron, NoMad, and SoHo, the requirements driving decisions toward premium space include:
- Natural light and layout quality — full-floor opportunities with open collaboration zones and multiple meeting rooms
- Modern HVAC and infrastructure — especially relevant as companies evaluate long-term operational costs
- Amenity access — rooftop terraces, wellness spaces, and wet-pantries have shifted from differentiators to baseline expectations
- Transit connectivity — direct subway access from multiple boroughs consistently ranks as a top-three requirement
- Design authenticity — tenants want space that reflects company culture, not generic coworking aesthetics

High-end Class A+ buildings reached 92.7% occupancy during the eight weeks before Memorial Day 2025, with Tuesday peaks hitting 94% of pre-pandemic attendance levels, per Colliers research. That attendance density is what's driving the flight to quality — companies want space that performs when the team is actually in it.
The Urgency Implication
That demand pressure is running directly into a constrained supply picture. With only 445,280 SF of post-2024 new supply available for lease across Manhattan as of early 2025 (Colliers), and Class A space being absorbed at over 2M SF per quarter, premium inventory is tightening fast. Landlords in top-tier buildings are negotiating from increasing strength. The window that existed 18 months ago, when tenants could take time, compare options, and extract generous concessions, is closing.
Trend 2: Tech and AI Companies Are Fueling a Demand Revival
Tech's Growing Share
Tech's share of Manhattan leasing activity rose from roughly 9% to nearly 15% year-over-year, with Avison Young's Q4 data showing tech at 14.7% of total leasing. That's a meaningful shift for a market historically anchored by finance and law.
AI firms specifically added roughly 1M SF across Manhattan in 2025, up 152% year-over-year, and were actively seeking another 1.4M SF, according to Bloomberg and JLL reporting. Companies like Perplexity have signed leases in neighborhoods like Union Square, reflecting a broader pattern of AI firms planting headquarters flags in Manhattan's core.
Nomad Group has seen this firsthand. The firm has represented AI and technology companies including Extend AI (NoMad, 3,500 SF, new lease with full buildout completed in five weeks) and FloraFauna AI (Williamsburg, 5,000 SF, new lease with the company doubling its footprint within one month of move-in) — both reflecting the rapid-growth, space-expanding pattern typical of AI-sector clients.
The Midtown South Effect
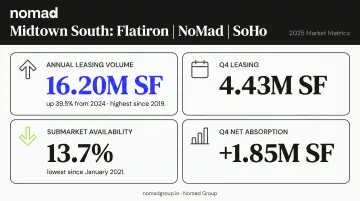
Midtown South — encompassing Flatiron, NoMad, and SoHo — has emerged as the clearest geographic expression of the tech and AI demand surge. Key 2025 metrics from Colliers tell the story:
| Metric | 2025 Result |
|---|---|
| Annual leasing volume | 16.20M SF (up 39.5% from 2024; highest since 2019) |
| Q4 leasing alone | 4.43M SF |
| Submarket availability | 13.7% (lowest since January 2021) |
| Q4 net absorption | +1.85M SF |
These are the neighborhoods where Nomad Group concentrates its work with scaling companies, and where authentic neighborhood character, transit access, and quality building stock have made them the first choice for high-growth tech and AI tenants.
Sector Mix: Tech Joins, Doesn't Replace, Traditional Pillars
Banking and FIRE sectors still lead Manhattan leasing at 34.3% of activity (Avison Young), with tech at 14.7%. Cushman separately reported financial services at 38.8% of Midtown annual leasing. The picture isn't one of tech displacing finance — it's additive demand, which is what makes 2025's leasing volume meaningful rather than a sector rotation story.
Trend 3: Sublease Space Hits Multi-Year Lows as New Leasing Confidence Grows
The flood of pandemic-era sublease space that defined the 2020–2022 market has largely cleared. Colliers reported 11.41M SF of sublet supply in Q4 2025 — down for the seventh consecutive quarter and the lowest since October 2019. CBRE put the sublease availability rate at 2.7%, down 40 basis points from the prior quarter.
The composition of leasing activity is also shifting:
- New leases and relocations accounted for 50.4% of Q4 activity (Savills)
- New and expansion leases represented 80% of Q1 2026 activity, with renewals falling to just 20% — down from 50% in 2023 (Avison Young Q1 2026 update)
- Mid-size deals (10,000–25,000 SF) represented 21.0% of 2025 leasing, with 25,000–50,000 SF deals adding another 15.3%
Large-block transactions drove the leasing headlines in 2025, but the growing share of mid-size deals signals something broader — companies across a range of sizes and sectors committing to space, not just a handful of financial services giants signing mega-leases.
For high-growth Series A–C companies, this is the more telling signal. More mid-size deals in play means more competition for the right spaces, but also more evidence that the market supports that kind of move right now.
What's Behind Manhattan's Recovery — and What to Watch
Core Demand Drivers
Three forces are working in concert:
- Return-to-office momentum: The Partnership for New York City's March 2025 survey found 57% average weekday attendance among Manhattan office workers, equal to 76% of pre-pandemic levels. Financial services and law each reported 62% daily attendance. Crucially, 75% of employers surveyed said current policy is the new normal — this isn't a temporary spike.
- Record employment: NYC private-sector employment reached 4.266M in November 2025, a record and 157,600 above pre-pandemic levels (NYCEDC). The city's job base supports ongoing office demand at a structural level.
- AI and tech sector growth: A sector that was contracting in Manhattan two years ago is now actively expanding. Firms are committing to deliberate space tied to real headcount growth — not positioning for a future that hasn't arrived yet.
The Structural Drag
The recovery has a ceiling, and it's the lower-tier overhang. The NYC Comptroller reported approximately 39M SF of Class B/C office space available citywide, with roughly 37M SF vacant — double the pre-pandemic vacant volume of 18.5M SF.
Manhattan has removed 8.76M SF from office inventory since Q1 2021 through conversions to residential and other uses. That helps, but the Class B problem is structural and slow-moving.
Three Factors to Watch
- AI's net effect on office employment — AI firms are currently adding headcount and space. Whether that trend sustains, or whether AI reduces employment in other sectors that offset these gains, will determine demand trajectory over a 3–5 year horizon.
- Pace of office-to-residential conversions — Removing obsolete lower-tier supply from the market is the cleanest path to broader market health. The NYC Comptroller tracked 44 completed, ongoing, or potential conversions totaling 15.2M gross SF citywide as of Q1 2025.
- Macroeconomic conditions — NYC job growth slowed materially in 2025 (18,600 private jobs added year-to-date versus 88,900 in the comparable 2024 period). If that pace holds, the leasing market will feel it — demand for new office space tracks hiring directly.
What These Trends Mean for Companies Leasing Manhattan Office Space in 2025
The tenant's position has changed. Two years ago, the balance of power clearly favored tenants — abundant sublease options, motivated landlords, generous concessions. That's no longer the baseline, particularly for quality space in Midtown South neighborhoods.
The current reality for companies evaluating space:
- Trophy and Class A availability is at historically low levels and declining each quarter
- Sublease inventory has largely cleared, removing a major source of discounted short-term options
- Midtown South availability (13.7%) is at its lowest since January 2021 and falling
- New and expansion leasing is accelerating — meaning more companies are competing for the same finite inventory
For companies with clear growth trajectories, the math on timing is shifting. Waiting for "better" market conditions carries real risk when the trend line on quality space is tightening, not loosening.
That context shapes how decisions should be structured right now.
Practical considerations for 2025 lease decisions:
- Flatiron, NoMad, and SoHo remain the neighborhoods tech and AI companies target first — for talent access, transit, and neighborhood character — but options are thinning fast
- With subleases largely gone and direct availability shrinking, a new direct lease makes increasing sense for companies with visibility into their next 2–4 years of growth
- In a market where quality space moves quickly, buildout speed matters as much as lease terms — Nomad Group's standard 90-day turnaround (Extend AI's full buildout wrapped in five weeks) means construction timelines don't have to stall a decision
Navigating this market well requires more than identifying available space. Concession structures, buildout costs, total occupancy economics, and neighborhood-level dynamics differ significantly block by block. Nomad Group works specifically with high-growth companies across Manhattan's most competitive neighborhoods — from initial search through lease execution and buildout — with 300+ tenant buildouts and 2M+ square feet leased as the track record behind that work.
Frequently Asked Questions
Is the Manhattan office market recovering in 2025?
Yes, across every major metric: Manhattan recorded its highest annual leasing volume since 2019 at 41.92M SF, availability has tightened for seven consecutive quarters, and net absorption turned strongly positive. The recovery is uneven by asset class, but the direction is clear.
What is the current office availability rate in Manhattan?
Colliers put Q4 2025 Manhattan availability at 13.9%, down from a post-pandemic peak of roughly 20% in mid-2023. CBRE and Avison Young report slightly higher figures (15.5% and 15.0%) due to methodology differences, but all three sources confirm a consistent decline.
What neighborhoods in Manhattan have the tightest office market conditions?
Midtown (trophy and Class A assets) and Midtown South — particularly Flatiron, NoMad, and SoHo — are the most competitive submarkets. Colliers reported Midtown South availability at 13.7%, its lowest since January 2021, driven heavily by tech, AI, and financial sector demand. Cushman identified Park Avenue as the tightest named submarket, with just 10.5% vacancy.
How are Manhattan office rents trending in 2025?
Overall asking rents reached their highest point since October 2020, with Colliers reporting $76.00/SF and CBRE at $77.89/SF. Trophy rents are running 6% above pre-pandemic levels while Class B/C rents remain 4% below. That gap between premium and lower-tier space is the defining rent story of this cycle.
Should I sign a long-term lease or look for flexible office space in Manhattan in 2025?
Companies with 2–4 years of clear growth visibility are increasingly committing to direct new leases as sublease options decline and Class A availability tightens. For early-stage companies or those with uncertain headcount, flex space remains the smarter play. Nomad Group's Flex by Nomad model is built for exactly that scenario.
What types of companies are driving Manhattan office demand in 2025?
Finance and FIRE sectors still lead at roughly 34–38% of leasing activity, but tech and AI companies have grown from 9% to nearly 15% of Manhattan leasing year-over-year. AI firms added an estimated 1M SF in 2025 and are actively seeking another 1.4M SF, making them one of the strongest forward demand signals in the market.