Introduction
Sign a commercial office lease without market data, and you're negotiating at a serious disadvantage — and landlords know it. Their brokers have access to every deal closed in your target submarket. You have an asking rent and a handshake.
This gap is exactly what a Comparative Market Analysis (CMA) is designed to close. For high-growth companies evaluating NYC office space, a well-executed CMA is the difference between a lease that fits your growth trajectory and one that bleeds budget for the next five to seven years.
Manhattan leasing hit 42.9 million square feet in 2025 — a 20.1% jump over 2024 and the highest annual total since 2014. The market is tightening, landlords are gaining leverage, and the window for aggressive tenant negotiation is narrowing. That makes getting the data right now more consequential than ever.
This guide covers what a commercial CMA is, why it matters at the negotiating table, how to run one step by step, and what it looks like in practice with a real NYC scenario.
Key Takeaways
- A CMA is a structured comparison of similar commercial spaces used to establish a defensible range of fair market lease rates and terms.
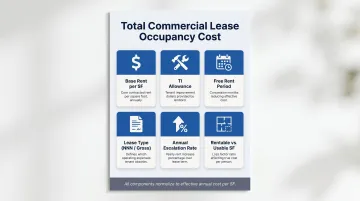
- In commercial real estate, comps go well beyond price per square foot — free rent, TI allowances, lease escalations, and expense structures all factor in.
- A strong CMA gives tenants concrete leverage, protects against above-market deals, and anchors counter-offers in real data.
- NYC sub-markets like NoMad, Flatiron, SoHo, and Williamsburg can have sharp pricing differences within a few blocks — local expertise isn't optional.
- Tenant reps typically provide a CMA at no cost to you — in NYC commercial leasing, broker fees are paid by the landlord.
What Is a Comparative Market Analysis in Commercial Real Estate?
A commercial CMA is a structured evaluation that compares a target property's proposed lease terms against recently signed leases, active listings, and available comps in the same submarket. The goal is to establish a defensible range of fair market value before you commit to anything.
Commercial CMA vs. Residential CMA
In residential real estate, a CMA is primarily about price per square foot and recent sale prices. Commercial leasing is structurally different — and the comparison stops there. The full economic picture of a commercial lease includes:
| Component | What It Means |
|---|---|
| Base rent (per SF) | The headline number — but rarely the full story |
| Tenant Improvement (TI) allowance | Landlord's per-SF contribution toward your buildout |
| Free rent | Rent abatement period, often during construction |
| Lease type (gross vs. NNN vs. modified gross) | Who pays operating expenses |
| Annual escalation rate | Typically 3% fixed, or tied to expense pass-throughs |
| Usable vs. rentable area | Rentable SF includes your share of common spaces |
Two leases at the same face rent can have dramatically different total occupancy costs once TI, free rent, and lease structure are factored in. A commercial CMA normalizes all of these variables onto a consistent basis — typically effective annual cost per square foot — so comparisons are actually meaningful.
Who Builds a Commercial CMA?
Tenant representative brokers with access to proprietary lease comp databases (primarily CoStar and CompStak) conduct these analyses. Public listing sites show asking rents. Executed deal terms, concessions, and effective rents live in platforms like these, not on Zillow or LoopNet.
Why a CMA Is Critical When Leasing Commercial Office Space
Asking rents and actual deal terms frequently diverge — sometimes by a significant margin. CBRE data shows that national average TI allowances reached $87.51 per SF in 2024, with free rent averaging 8.9 months — still roughly 30% above 2019 pre-pandemic levels. The headline rent a landlord quotes you rarely reflects what comparable tenants actually paid — or what they negotiated to get there.
A CMA bridges that gap.
Five Ways a CMA Directly Improves Lease Outcomes
- Knowing what comparable tenants actually paid — including concessions — lets you push back on inflated asking rents with data, not guesswork.
- Informed budgeting — understanding true total occupancy cost, including operating expenses and TI assumptions, prevents costly surprises after signing.
- Flagging out-of-market terms before you sign reduces the risk of locking into an above-market deal for 5–10 years.
- Speed and decisiveness — tenants who understand market context can move fast when a strong opportunity appears, without second-guessing whether the terms are fair.
- For companies evaluating NoMad vs. Flatiron vs. SoHo, a CMA enables apples-to-apples comparison across neighborhoods with meaningfully different pricing dynamics.
For high-growth companies, a commercial lease is typically one of the largest fixed-cost commitments on the books — which means the CMA isn't just a research exercise. It's what makes the negotiation winnable.
According to TenantBase research from February 2026, professional tenant representation reduces total occupancy costs by 15–25% over the lease term through expert negotiation and competitive deal structuring. On a 5-year lease at $80/SF for 5,000 SF, that's a difference of $200,000 or more — and it begins with knowing what the market actually looks like before you walk into a negotiation.
How to Conduct a Commercial Real Estate CMA — Step by Step
A commercial CMA is more nuanced than a residential one. Most real deal data isn't publicly available, which makes access to comp databases and broker networks essential. Here's how a rigorous analysis gets built.
Step 1 — Define the Search Parameters
Establish the baseline criteria before pulling a single comp: building class (A, B, or C), approximate square footage range, target neighborhood, desired lease term length, and any space-specific requirements — floor-through, private entrance, HVAC flexibility, and so on.
Getting specific here matters. Comparing a raw loft in SoHo to a pre-built Class A floor in the Flatiron District produces meaningless results.
Step 2 — Identify Comparable Transactions
Pull recently signed leases — ideally within the past 12–18 months — for spaces with similar attributes in the same submarket. Include active listings for current context, but weight executed deals more heavily. Asking rents rarely equal executed rents, particularly in a market where landlord concessions remain elevated.
A practical standard: aim for 3–5 strong comps. Fewer than three increases analytical risk; using deals older than 18 months risks misrepresenting current conditions in a market moving as quickly as Midtown South.
Step 3 — Gather and Normalize the Data
Collect the full economic picture for each comp — not just the face rent:
- Effective rent (face rent adjusted for free rent periods)
- TI allowance per SF
- Lease type (NNN, gross, or modified gross)
- Annual escalation rate
- Any landlord-paid buildout contributions
Normalizing these to a consistent basis — effective annual cost per square foot — is the only way to compare deals fairly. A lease with a lower face rent but no TI allowance and zero free rent may cost a tenant more over five years than one with a higher headline number and generous concessions.
Step 4 — Adjust for Differences
No two spaces are identical. Apply adjustments for each variable that differentiates your comps:
- Building class and condition (Class A vs. B, pre-built vs. raw)
- Floor level and natural light
- Amenity package (roof access, bike storage, conference facilities)
- Proximity to transit
- Lease flexibility (early termination options, renewal rights)
This is where broker expertise and local market knowledge matter most. A comp that looks identical on paper can carry meaningfully different effective costs once these factors are priced in.
Step 5 — Establish the Market Range and Act
After normalizing and adjusting, synthesize the comps into a low/mid/high market rate range. Use this range to anchor your initial offer, set counter-offer benchmarks, and guide ongoing negotiations. If the deal timeline stretches past six months, revisit the data — Midtown South availability dropped 540 basis points in a single year according to Avison Young's Q1 2026 Manhattan report, and market conditions are shifting faster than many tenants expect.

Commercial CMA in Action: A NYC Office Leasing Example
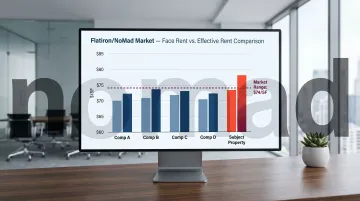
The scenario: A Series B fintech company with 40 employees needs approximately 6,000 SF of Class B office space in the Flatiron/NoMad corridor on a 5-year lease. The landlord's proposal comes in at a headline rent of $82/SF gross. The question: is this market?
What the CMA Reveals
A tenant rep broker pulls four comparable executed transactions from the past 14 months in the same submarket — all Class B, similar SF ranges, 5-year terms. Here's what normalized data looks like across four comparable transactions:
| Comp | Face Rent | Free Rent | TI Allowance | Effective Rent* |
|---|---|---|---|---|
| Comp A | $79/SF | 4 months | $65/SF | $71/SF |
| Comp B | $85/SF | 6 months | $75/SF | $73/SF |
| Comp C | $76/SF | 3 months | $55/SF | $70/SF |
| Comp D | $83/SF | 5 months | $70/SF | $74/SF |
| Subject Property | $82/SF | 2 months | $45/SF | ~$78/SF |
Effective rent calculated by amortizing free rent and TI value over the lease term.
The CMA makes the problem visible. The subject property's headline rent of $82/SF looks competitive against the comp set — but its concession package is materially weaker. With only 2 months of free rent and a $45/SF TI allowance, the effective rent lands around $78/SF, well above the $70–$74/SF range the market is actually clearing for comparable spaces.
The Adjustment Layer in Action
Comp B carries a higher face rent of $85/SF — but its 6-month free rent and $75/SF TI allowance bring its effective cost below the subject property. A pre-built space at a slightly higher headline number might still be cheaper over the life of the lease than a raw space requiring a full buildout with inadequate TI support.
This is why normalizing matters. Without it, the tenant looks at $82/SF and thinks it's in the ballpark.
The Outcome
With the CMA in hand, the tenant has specific, data-backed leverage. Three negotiation levers open up immediately:
- Free rent: Push from 2 months to 4–5, consistent with every comp in the set
- TI allowance: Request an increase from $45/SF toward the $65–$75/SF range comparable landlords are offering
- Face rent: A modest reduction brings the effective rent in line with market
Each ask is grounded in executed transactions — not opinion. That's the difference between a counter-offer the landlord takes seriously and one they dismiss.
How Nomad Group Can Help
Nomad Group works with high-growth companies — Series A through enterprise — leasing office space across NYC's most active submarkets. The team has direct visibility into what deals are actually getting done across:
- NoMad, Flatiron, and SoHo — Manhattan's core tech and startup corridors
- Union Square and Grand Central — established enterprise hubs with strong availability
- Williamsburg — a growing destination for companies prioritizing culture and design
Over 2 million square feet leased and 300+ tenant buildouts completed.
A full CMA is a foundational step in Nomad Group's tenant representation process. Before clients enter any negotiation, they have a clear market picture, defined leverage points, and a strategy built on executed deal terms, not just asking rents.

Because Nomad Group isn't driven by volume quotas or landlord incentives, the CMA reflects the market as it is. The goal is the best possible terms for the tenant. And since broker fees in NYC commercial leasing are typically paid by the landlord, professional representation through Nomad Group comes at no direct cost to the tenant.
If your company is evaluating office space in NYC, connect with the Nomad Group team before you respond to your next lease proposal.
Frequently Asked Questions
What is a comparative market analysis (CMA)?
A CMA is a data-driven comparison of similar properties used to determine fair market value or lease rates. In commercial real estate, it evaluates executed lease terms — including concessions and total occupancy cost — not just asking rents.
What is the primary purpose of a comparative market analysis?
The core purpose is to establish a defensible market rate range that gives tenants or buyers the data needed to negotiate confidently and avoid overpaying. It replaces guesswork with actual deal data you can use at the negotiating table.
How does a broker conduct a commercial CMA?
A broker identifies recent comparable transactions, gathers full economic terms (face rent, TI, free rent, lease type), adjusts for physical and locational differences, and synthesizes results into a low/mid/high range. Access to databases like CoStar and CompStak is essential — executed deal terms are rarely public.
How many comps should be used in a commercial CMA?
A minimum of 3–5 comps is the standard, drawn from transactions within the past 12–18 months in the same submarket and building class. Fewer comps increase analytical risk; in low-transaction markets, fewer may be acceptable if supported with additional market context.
How accurate are commercial CMA valuations?
Accuracy depends on data quality, comp selection, and the analyst's market knowledge. Commercial CMAs carry additional complexity because concession packages and effective rents often diverge substantially from stated asking rents — making thorough normalization essential.
Do brokers charge for a commercial CMA?
Most tenant representative brokers provide a CMA as part of their leasing services at no direct cost to the tenant. In NYC, broker fees are customarily paid by the landlord as a percentage of base rent over the lease term — so professional representation costs tenants nothing out of pocket.