Introduction
Signing an NYC office lease without market data is expensive. Not in an abstract sense — in a concrete, locked-in-for-five-years sense. Companies that skip this research routinely overpay on base rent, leave TI allowances on the table, and commit to spaces that don't fit their growth trajectory six months later.
The NYC commercial office market doesn't make this easy. You're navigating Midtown, Midtown South, Downtown, SoHo, Williamsburg, and a dozen micro-corridors, each with its own vacancy dynamics, landlord profiles, and pricing logic.
The numbers reflect how much is at stake. Manhattan recorded 39.8 million SF of leasing activity in 2025 — the highest since 2019 — while NYC office vacancy fell to 14.8%, a five-year low. A tightening market with surging deal volume means tenants who show up without data are negotiating blind against landlords and their agents who have all of it.
This guide breaks down what a commercial office market analysis covers, why it matters before you tour a single space, and how to use it to negotiate from a position of strength.
Key Takeaways
- A market analysis examines vacancy rates, asking vs. effective rents, absorption trends, and lease comps across your target submarkets.
- NYC conditions vary dramatically by submarket — Midtown South Class A averages $94.82/SF while Downtown space runs $57.41/SF.
- Skipping this step typically means overpaying on rent, under-negotiating concessions, or choosing the wrong neighborhood entirely.
- The process: define requirements → gather submarket data → analyze comps → build your negotiating position.
- Tenant rep brokers are landlord-compensated — market analysis and representation cost tenants nothing.
What Is a Commercial Office Market Analysis?
A commercial office market analysis is a structured assessment of conditions in a specific real estate market — examining how much space is available, what it costs, how fast it's leasing, and what terms landlords are willing to offer. It gives tenants a factual baseline before making any leasing decision.
Unlike a business market analysis — which studies consumer demand or industry trends — a commercial real estate market analysis focuses on supply, demand, and deal economics:
Supply-side metrics:
- Vacancy rate (physically empty space as a percentage of total inventory)
- Availability rate (vacant and occupied space being marketed for future lease)
- New construction and sublease pipeline
Demand-side signals:
- Net absorption (net change in occupied space over time)
- Leasing velocity (SF transacted per quarter)
Financial terms:
- Asking rent vs. effective rent (what tenants actually pay after concessions)
- Tenant improvement (TI) allowances
- Free rent periods
- Escalation clauses
Two Levels of Analysis
A complete market analysis involves both:
- Submarket overview — how a specific corridor (say, Flatiron/NoMad) is performing relative to the broader Manhattan market
- Comparable deal analysis — executed transactions matching your size, class, and neighborhood, used to benchmark what tenants like you are actually paying
Neither alone is sufficient — the overview tells you where the market stands, while the comps tell you what you should actually be paying.
Why a Market Analysis Is Critical Before Leasing NYC Office Space
The Rent Transparency Gap
Asking rents in NYC are marketing numbers. What tenants actually pay — the effective rent — can run far lower after concessions are factored in.
According to Avison Young's Q2 2025 report, the gap between Class A base rents and net effective rents hit a record high of $30/SF. For a 5,000 SF tenant, that's $150,000 per year in negotiable value — invisible to anyone who accepts the asking price at face value.
Concessions are shifting as the market tightens — TI allowances dropped from $162/SF to $133/SF, and free rent periods contracted from 14.5 to 12.5 months through late 2025. The window is narrowing. Knowing where you sit on that curve determines how much of that $150,000 you actually capture.
Submarket Conditions Determine Your Leverage
NYC isn't one office market — it's a collection of distinct submarkets with very different supply dynamics.
| Submarket | Avg. Asking Rent/SF | Notes |
|---|---|---|
| Midtown Trophy | $132.24 | Near all-time low vacancy at 7.6% |
| Midtown South (Class A) | $94.82 | Leasing demand up 30.9% YoY in Q4 2025 |
| Midtown South (Class B) | $64.12 | Meaningful spread vs. Class A |
| Downtown Manhattan | $57.41 | Highest vacancy among major submarkets |
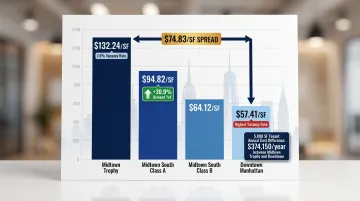
The rent spread between Midtown trophy and Downtown is $74.83/SF. For a 5,000 SF tenant, that's ~$374,000/year in base rent difference before any negotiation begins. Submarket selection is the single biggest lever most tenants never pull.
Timing Errors Are Costly
Available sublease space in Manhattan fell to approximately 12 million SF by late 2025 — down nearly 50% from its 2023 peak. Companies that acted on this trend in early 2024 held meaningfully more leverage at the negotiating table.
Timing the search matters just as much as pricing it. Entering a search without visibility into sublease inventory expiring in the next 60–90 days can mean signing a lease the week before a better space hits the market. A current market analysis surfaces that pipeline — specific availabilities, expected pricing, and landlord motivation — before you commit.
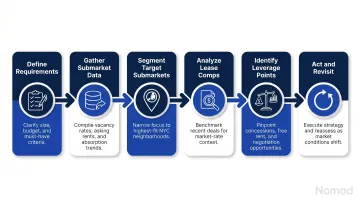
How to Conduct a NYC Commercial Office Market Analysis — Step by Step
Step 1: Define Your Requirements First
Before gathering any data, lock down your parameters:
- Target headcount and SF per person (NYC typically runs 100–175 SF/person for private offices)
- Neighborhood preferences and hard limits
- Lease term flexibility (3-year vs. 5-year changes your negotiating position significantly)
- Absolute budget ceiling — not a range
Common mistake: Companies tour spaces before defining requirements, then compare a 4,000 SF Class B loft in SoHo against a 6,500 SF Class A floor in NoMad. The data becomes meaningless because the baseline keeps shifting.
Step 2: Gather Submarket and Market-Wide Data
Collect key metrics for your target areas:
- Total available inventory (direct vs. sublease)
- Availability rate and recent trend direction
- Asking rent ranges (full-service gross vs. NNN)
- Net absorption over the past 2–4 quarters
- New supply entering the pipeline
Where to source this data:
- Free: Quarterly market reports from Colliers, Cushman & Wakefield, JLL, CBRE, and Avison Young — all publish NYC-specific snapshots. Colliers additionally publishes individual submarket reports for Midtown, Midtown South, and Downtown each quarter.
- Paid/broker access: CoStar and CompStak for transaction-level comp data and verified lease terms
- Not sufficient alone: LoopNet shows a fraction of available inventory. Most serious deals — especially off-market subleases and pre-market opportunities — never appear there.
Step 3: Segment Your Target Submarkets
Narrow from city-wide to two or three target neighborhoods. Compare them side by side on:
- Vacancy and availability rate
- Rent trends (tightening or softening?)
- Tenant mix and neighborhood profile
- Building class availability within your budget
In Midtown South, for example, the spread between Class A ($94.82/SF) and Class B ($64.12/SF) is $30.70/SF — translating to $153,500/year for a 5,000 SF tenant. Choosing the right building class within the right submarket is often worth more than the entire lease negotiation that follows.
Class B buildings in high-demand neighborhoods offer better value and faster deal timelines than Class A buildings with institutional landlords who move slowly and maintain standardized lease structures.
Step 4: Analyze Comparable Deals
Pull recent lease comps — executed transactions from the past 6–12 months for spaces comparable in size, class, and neighborhood. For each comp, examine:
- Headline rent (asking/face rent)
- Effective rent (after free rent and TI are factored in)
- Free rent period (months)
- TI allowance ($/SF)
- Lease term
This is where broker-represented tenants have their clearest edge. Comp data from closed transactions lives in CoStar and CompStak — platforms generally inaccessible to unrepresented tenants. Brokers with active deal flow in your target submarket have visibility into effective economic terms that never appear in marketing materials. A tenant negotiating directly against a landlord's broker is working with incomplete information, and landlords price that gap into the deal.
Step 5: Interpret Conditions and Identify Leverage Points
Translate your data into a clear read on market conditions:
- Is the submarket tightening (rising rents, declining availability, shrinking concessions)?
- Or softening (landlords offering more free rent, larger TI, shorter terms)?
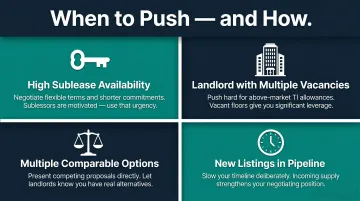
Then translate that into specific leverage points:
- High sublease availability: push for flexible term options and shorter initial commitments
- Landlord with multiple vacancies in one building: motivated to offer above-market TI to secure a tenant
- Multiple comparable options in your size range: use competing proposals actively, not as a bluff
- Pipeline of new listings expected: consider slowing down to strengthen your negotiating position
Step 6: Act — and Revisit
Use the analysis to frame your initial offer, set walk-away terms, and rank spaces before you tour. Going in without this foundation means the landlord's broker controls the narrative from the first conversation.
One critical caveat: the NYC market shifts continuously. A Q1 analysis may call for patience; by Q3, tightening conditions can make speed the smarter move. If your search extends over several months, revisit key metrics quarterly.
NYC Office Market Analysis in Action: A Practical Example
A Series B SaaS company with 45 employees is looking for 5,000–6,500 SF in the Flatiron/NoMad corridor. They have a budget ceiling and want a direct lease of 3–5 years.
What the Data Reveals
The Flatiron/NoMad district reported a district-wide office availability rate of 22% in Q3 2024, with 65% of new leases signed for spaces under 5,000 SF — strong small-tenant demand in exactly their size range.
Midtown South's average asking rent of $82.12/SF (Class A: $94.82, Class B: $64.12) gives them an immediate data point: targeting Class B space in this corridor saves roughly $30/SF before negotiations even start.
How Comp Analysis Changes the Negotiation
Recent comps in the submarket show landlords offering 10–12 months of free rent and TI allowances ranging from $64–$133/SF depending on building class and deal structure. Instead of accepting a landlord's first counter, the company walks in knowing what comparable tenants received. They make specific asks — not vague requests — backed by actual transaction data.
The Mistake They Almost Made
Three weeks into their search, they're close to committing to a 5,800 SF floor in a Class B building at $68/SF. A market-aware advisor spots three sublease listings expected to hit the market within 60 days — comparable spaces that would give the company additional leverage. They slow down, run a parallel process, and use the emerging competition as leverage with the current landlord.
The Outcome
Relative to the landlord's opening proposal, the market analysis translated into three measurable improvements:
- A lower effective rent
- Two additional months of free rent
- A TI allowance $20/SF above the initial offer
That's the difference between leasing blind and leasing with data.
This is the exact type of client Nomad Group works with regularly. The firm's portfolio includes companies like Authentic Insurance, which secured a 5,500 SF full-floor space in Flatiron at 30% under comparable coworking costs, and Optimove, which landed a full-floor sublease with a private rooftop terrace through an off-market opportunity the team surfaced before it hit public listings.
How Nomad Group Helps You Navigate the NYC Office Market
Nomad Group has completed 300+ tenant buildouts and leased over 2 million square feet across NYC's high-growth neighborhoods — NoMad, Flatiron, SoHo, Williamsburg, Union Square, and beyond. That deal flow isn't just a credential; it's the source of market intelligence that no quarterly report can replicate.

Working across the full leasing cycle, the team:
- Surfaces off-market sublease opportunities before they hit public listings
- Maintains direct relationships with ownership groups like Justin Management and Kaufman Organizations
- Tracks what comparable tenants in your target submarket are actually paying — not just asking rents
The practical difference: when Nomad worked with Optimove, they uncovered a Lazard Asset Management sublease that wasn't publicly listed — a full-floor space with premium amenities and a private 3,000+ SF rooftop. When timing complications arose, the team used Nomad's managed portfolio to provide swing space, allowing Optimove to negotiate the sublease without pressure.
Nomad's market analysis feeds directly into lease negotiation, space planning, and buildout. The firm manages everything from initial market overview through signed lease to delivered space, so clients don't lose context switching between advisors at each stage.
For companies not yet ready for a direct lease, Flex by Nomad offers a full-service alternative without coworking-level costs, bridging the gap until a direct lease makes sense.
Ready to understand what your target NYC submarket is actually offering? Connect with Nomad Group's team for a complimentary market overview before you begin your search.
Conclusion
A NYC commercial office market analysis isn't background research. It's the foundation of every smart leasing decision — from selecting the right submarket and benchmarking rent to knowing when to push hard for concessions and when the market's tightening and speed matters more than patience.
The NYC office market will keep shifting. Hybrid work, the ongoing flight to quality, tightening sublease inventory, and shifting submarket demand mean the conditions that applied six months ago may not apply today. The companies that navigate this well treat market analysis as a continuous input — not a one-time exercise before signing.
That's how Nomad Group approaches every tenant engagement: with current data, submarket-level context, and direct access to what's actually moving in neighborhoods like Flatiron, NoMad, and SoHo. If you're preparing to enter the market or renegotiate an existing lease, that kind of ongoing intelligence is what separates a good deal from a great one.
Frequently Asked Questions
What is market analysis in simple terms?
Market analysis in commercial leasing is the process of gathering and interpreting data on available spaces, prevailing rents, vacancy trends, and recent deal terms in a specific area. It tells you what the market is actually offering before you sit down to negotiate — so your position is grounded in data, not guesswork.
What is the goal of market analysis?
The goal is to pin down what comparable spaces actually cost and what concessions landlords are currently offering. That knowledge keeps you from overpaying on a lease that could represent a multi-year, seven-figure commitment.
What are the steps of a market analysis?
The key stages are defining your space requirements, gathering submarket data (vacancy, absorption, rents), and comparing target neighborhoods. From there, you analyze recent lease comps, read current market conditions for leverage points, and build a data-backed negotiating position.
Do realtors charge for a market analysis?
In NYC commercial leasing, tenant rep brokers are compensated by the landlord through a commission split — typically 4–6% of total lease value. Tenants pay nothing out of pocket for brokerage services, including market analysis. Without a tenant rep, that commission goes entirely to the landlord's agent.
How do you prepare a market analysis report?
A commercial office market analysis report covers submarket vacancy and availability data, asking vs. effective rent ranges, recent lease comps with concession details, landlord TI and free rent benchmarks, and a summary of current market conditions — all framed around your specific size, budget, and location requirements.