Introduction
New York City's commercial office market is the largest in North America — nearly 730 million square feet spread across five boroughs, with Manhattan alone accounting for over 594 million square feet. No other North American city comes close.
That scale creates opportunity. It also creates complexity that catches companies off guard.
High-growth startups and scaling tech firms often enter lease negotiations without a clear picture of current availability rates, rent dynamics, or how shifts in tenant demand affect their options. In a market moving as fast as Manhattan's right now, that knowledge gap translates directly into money left on the table — or worse, a lease signed at the wrong time, in the wrong building, at the wrong price.
This article covers what you need to know to negotiate from a position of strength:
- The metrics that define today's NYC office market
- The trends reshaping tenant demand right now
- How key neighborhoods compare for tech and startup tenants
- How to turn market intelligence into real negotiating leverage
Key Takeaways
- Manhattan office availability has dropped to 14.6% in Q1 2026, down sharply from its post-pandemic peak — the market is tightening fast
- Trophy and Class A buildings are absorbing well; Class B/C space continues to struggle, creating a bifurcated market
- Midsize deals of 10,000–50,000 sq ft now capture 40.5% of Manhattan leasing activity — the segment where most scaling startups compete
- Neighborhood choice matters: NoMad, Flatiron, SoHo, and Williamsburg each carry distinct pricing, tenant profiles, and lease dynamics
- Tenants who understand the market before negotiating win better rent, TI allowances, and lease terms
What Is a NYC Commercial Office Market Analysis?
A commercial office market analysis is the systematic evaluation of supply, demand, pricing, vacancy, and leasing activity across a defined geography to assess current conditions and near-term direction. For tenants, the practical output is straightforward: knowing whether you're entering a landlord-favored or tenant-favored environment before you sign anything.
Who Uses It and Why
Institutional investors and landlords use market analysis to price assets. Tenants and their advisors use it to:
- Time their search relative to market cycles
- Benchmark asking rents against actual market rates
- Identify which submarkets offer the best value for their profile
- Negotiate lease terms from a position of knowledge, not guesswork
The Data That Matters
NYC office market analysis draws on several distinct data types:
| Metric | What It Tells You |
|---|---|
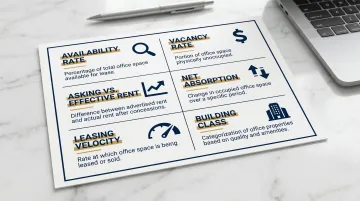
| Availability rate | All space actively marketed, including occupied sublease space |
| Vacancy rate | Space that is physically unoccupied |
| Asking vs. effective rent | Headline rate vs. what you actually pay after concessions |
| Net absorption | Whether more space is being leased or vacated each quarter |
| Leasing velocity | Total square footage transacted — signals market momentum |
| Building class | Trophy / Class A / B / C — affects pricing, amenities, and landlord flexibility |
The gap between availability and vacancy is worth tracking closely. When available space far exceeds physically vacant space, a large portion of marketed inventory is still occupied, meaning landlords face less immediate pressure to negotiate.
Key Metrics That Define the NYC Office Market Right Now
Availability vs. Vacancy
Manhattan's overall availability rate hit 14.6% in Q1 2026 per Avison Young's Q1 2026 report, down from 17.3% a year prior and 540 basis points below the Q3 2024 peak. Colliers reports an even tighter 13.7%, reflecting different methodological approaches.
Both figures point the same direction: quality supply is tightening, and landlords in premium buildings are gaining pricing confidence as a result.
Asking Rent vs. Effective Rent
Headline asking rents by building class in Q1 2026:
| Building Class | Asking Rent (per SF/year) |
|---|---|
| Trophy | $143.04 |
| Class A | $88.80 |
| Class B/C | $64.22 |
The number that actually matters is effective rent — what you pay after landlord concessions are factored in. For Manhattan Class A deals on longer-term leases, tenant improvement (TI) allowances average around $150/sf, with free rent periods typically running 12–15 months. Nationally, average TI allowances were $87.51/sf in 2024, down from $97.55/sf in 2023 — the first decline since CBRE began tracking this metric in 2019 — but Manhattan's concession packages remain well above the national average.
A $143/sf Trophy asking rent may come with a TI package and free rent that reduces your effective first-year cost substantially. Before comparing spaces, ask your broker to model total occupancy cost over the lease term — headline rent alone won't give you an accurate picture.
Net Absorption
Manhattan recorded positive 2.0 million square feet of net absorption in Q1 2026, according to Colliers. Positive absorption means more space is being leased than vacated — the market is tightening. Nationally, Q1 2026 net absorption reached 6.9 million square feet, the strongest Q1 figure since 2020 and the eighth consecutive quarter of positive demand.
For tenants, positive absorption is a signal to move with intention. Waiting for conditions to improve further means competing for less inventory at higher prices.
NYC Office Market Trends Tenants Need to Know
Leasing Activity Has Established a New Baseline
Manhattan leasing reached 10.4 million square feet in Q1 2026 — 41% above the 2020–2024 first-quarter average per Avison Young. Colliers puts Q1 2026 volume at 11.78 million square feet, calling it the strongest first quarter since 2014.
Full-year 2025 Manhattan demand reached 42 million square feet, up 7% over 2024. The post-pandemic recovery has produced a sustained, higher baseline of leasing activity — confirmed across multiple consecutive quarters.
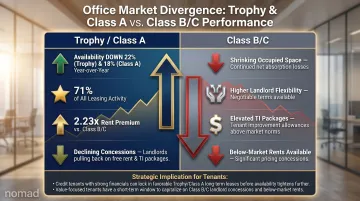
Flight to Quality Is Accelerating
The market is bifurcating sharply by building class, and it's the trend with the most direct impact on tenant decisions right now.
- Trophy space availability dropped 22% year-over-year (21.2M to 16.9M SF)
- Class A availability declined 18% year-over-year (30.7M to 25.2M SF)
- Class A space captured over 71% of Q4 2025 leasing activity per Lee & Associates
Meanwhile, Class B and C buildings have seen occupied space shrink. The rent premium reflects this dynamic — Trophy space commands 2.23x the per-square-foot cost of Class B/C.
For tenants, this creates a genuine strategic choice. Quality space is being competed for aggressively and concessions are declining. Lower-tier buildings may offer more landlord flexibility, higher TI packages, and below-market rents — but come with trade-offs in amenities, talent perception, and lease flexibility.
Renewals Are Out. New Leases Are In.
Renewals dropped from 50% of leasing activity in 2023 to just 20% in Q1 2026. New leases and expansions now represent 80% of the market.
Companies are actively committing to new, larger, or better space because business visibility has improved. That confidence is real — and it's pulling available inventory off the market faster than most tenants anticipate when starting their search.
The Midsize Segment Is Where Startups Compete
Deals in the 10,000–50,000 SF range now capture 40.5% of Manhattan leasing activity, up from 35.4% a year ago. Large block leasing (100,000+ SF) actually slowed in early 2026.
Two data points define this segment right now:
- 40.5% of Manhattan leasing activity falls in the 10K–50K SF range — the sweet spot for Series A through Series C companies
- 20.3% of Q1 2026 leasing was driven by technology tenants — the highest share since 2019
FIRE sector firms, tech companies, and law firms are all competing in this same band. For scaling startups, that means more competition, less leverage, and a narrower window to act on the right space.
Neighborhood Breakdown: Where High-Growth Companies Are Leasing
Midtown South: NoMad, Flatiron, Union Square
This corridor is NYC's de facto startup and tech hub, sometimes called "Unicorn Lane" by teams who work it regularly. Nomad Group has anchored a significant portion of its portfolio here for good reason. The draw includes:
- Walkable streets and strong transit access
- Modern boutique Class A buildings across multiple price points
- Dense concentration of engineering and product talent
- Reasonable rents compared to Trophy Midtown product
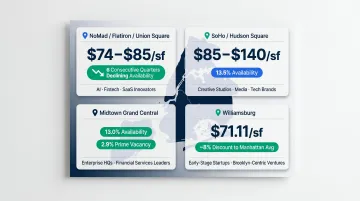
Asking rents in this submarket range from approximately $74–$85/sf for Class A space, with availability declining for six consecutive quarters. AI, fintech, and SaaS companies have kept demand firm while maintaining more reasonable rents than Trophy Midtown product.
Nomad Group has executed deals across this corridor for clients including Authentic Insurance (5,500 SF at 30 West 21st Street, Flatiron, delivered 30% under comparable coworking costs) and Extend at 135 West 29th Street in NoMad.
SoHo and Hudson Square
SoHo carries a 13.5% availability rate per Avison Young — among the tighter Manhattan submarkets. Class A space in SoHo averages around $130/sf, with the range spanning $85–$140/sf depending on floor and building quality.
Creative, media, and tech-adjacent companies prioritize SoHo for its design-forward loft spaces and brand environment. The Horizon Media lease extension: 360,000 SF at 75 Varick Street in Hudson Square for 17 years is exactly the kind of long-term commitment that signals landlord confidence and firm pricing in this corridor. Timing and relationships matter more here than in submarkets with wider availability.
Midtown: Grand Central / Park Avenue
The traditional large-block zone, better suited to enterprise companies and financial services tenants. Grand Central's availability stands at 13.0%, with Midtown prime vacancy falling to just 2.9% per CBRE.
Recent commitments tell the story: Blackstone (1,000,000 SF at 345 Park Avenue), Citadel (504,000 SF at 660 Fifth Avenue), and Amazon (344,000 SF at 452 Fifth Avenue), all 2025 deals per Commercial Observer. For growth-stage startups, this submarket is generally better accessed through sublease opportunities from large financial tenants downsizing their footprints.
Williamsburg and Outer-Borough Markets
When Midtown pricing pushes even sublease budgets out of range, Williamsburg becomes a serious option. Williamsburg/Greenpoint office space averages $71.11/sf, roughly an 8% discount to the Manhattan average of $77.55/sf and closer to 20% against Manhattan Class A. The savings are real, though narrower than most teams expect for premium Williamsburg product.
Nomad Group placed FloraFauna AI at 300 Kent Avenue (The Refinery at Domino), a Class A waterfront building by Two Trees. Within 30 days of move-in, Flora was looking to double their footprint. That's about as clear a vote of confidence as a relocation gets.
The trade-offs are worth naming plainly:
- Floor plate options are smaller than Manhattan equivalents
- Transit access doesn't work for every team's commute profile
- The talent pool skews toward specific sectors
Early-stage startups with Brooklyn-centric teams are the best fit here.

How to Use Market Intelligence to Make Smarter Leasing Decisions
Start Earlier Than You Think Is Necessary
In a tightening market, 12–18 months before target occupancy is no longer a conservative timeline. It's the minimum. When availability is declining quarter-over-quarter and quality blocks are absorbing quickly, companies that enter the market late lose on two fronts: selection and leverage.
If your lease expires in the next 1–3 years, the current window — while sublease overhang still exists and some landlords remain open to concessions — is the right moment to begin a formal search.
Use Pockets of Softness as Leverage
Even in a tightening overall market, pockets of elevated sublease availability remain — particularly in Class B/C buildings and specific submarkets. These pockets give tenants leverage to negotiate:
- Below-market base rents
- Higher TI allowances to fund buildout
- Shorter initial lease terms or expansion options
- Favorable termination rights
Knowing where these pockets exist requires granular, building-level intelligence. The difference between a publicized 14.6% availability rate and the actual availability in a specific building class within a single NoMad block can be significant — and that gap is where deals get made.
Work with Advisors Who Know the Buildings, Not Just the Data
Nomad Group translates raw market data into executed, optimized lease deals for high-growth companies across NoMad, Flatiron, SoHo, Union Square, Williamsburg, and Grand Central.
What sets the firm apart isn't just market knowledge:
- 2M+ square feet under management across NYC's core office submarkets
- 300+ tenant buildouts completed, with an average 90-day turnaround
- Landlord relationships built over hundreds of transactions — the kind that surface off-market space before listings go wide
- Deep submarket fluency, from building-specific concession histories to landlord negotiating styles

Tenant representation through Nomad Group carries no direct cost to the tenant. Broker compensation is paid by the landlord upon deal execution, so market intelligence, deal strategy, and lease negotiation are all provided without a separate fee.
Frequently Asked Questions
How is the real estate market in Manhattan right now?
Manhattan's office market is in active recovery — leasing activity in Q1 2026 ran 41% above the 2020–2024 average, and tenants are signing new and expansion leases at the highest rate since before the pandemic. It's a bifurcated market: Trophy and Class A space is tightening, while Class B/C buildings face ongoing pressure.
Are real estate prices dropping in New York?
Not across the board. Class B/C asking rents remain soft and landlords in those buildings are still offering meaningful concessions. Trophy and high-quality Class A rents are holding firm, with Trophy space now averaging $143/sf. The effective rent you pay depends heavily on building class, submarket, and how well you negotiate.
Is New York City growing or declining?
NYC's office-using sectors are expanding. Financial activities added 1,900 jobs and information (tech proxy) added 900 jobs over the year to March 2026, with the NYCEDC reporting a record 4.26 million private sector jobs as of mid-2025. High-growth companies are actively committing to office space again.
What are the predictions for the NYC real estate market?
Consensus points to continued tightening for quality space, rent growth in Trophy and Class A submarkets, and ongoing pressure on Class B/C inventory. The midsize lease segment (10,000–50,000 SF) is expected to stay the most active tier, driven by startups and growth-stage companies. Per PwC/ULI, approximately 69% of office tenants plan to maintain or expand their footprint.
What is the NYC real estate prediction for 2026?
Availability is expected to continue declining, sublease overhang is nearly absorbed (sublease space is down nearly 30% year-over-year per Colliers), and landlord confidence is returning in quality submarkets. The window for tenant-favorable deals is narrowing, particularly in Midtown South and SoHo, where demand from AI, fintech, and creative tech tenants remains strong.
How much does it cost to have a market analysis done?
Tenant-side market analysis costs nothing through a tenant representation broker like Nomad Group. The broker is compensated by the landlord at lease execution, so tenants receive expert market intelligence, space search support, and full lease negotiation at no direct cost.