Introduction
A commercial lease is typically your startup's second or third largest expense after payroll. In New York City, that means $200,000 to $500,000 per year for a growing team of 25. Yet most founders treat office space like a commodity purchase—comparing a few listings and signing the first lease that fits their square footage needs.
That approach breaks down when market conditions shift. A lease signed at peak rates without understanding vacancy trends or concession leverage can lock your company into above-market rent for five years, bleeding cash that should fund product development or hiring.
The cost of uninformed leasing goes beyond overpaying on rent. Startups that skip market analysis routinely miss free rent periods that could save $50,000 in year one, tenant improvement (TI) allowances averaging $150 per square foot, and flexible expansion rights that align with Series B growth.
According to Cushman & Wakefield's Q4 2025 data, Manhattan office vacancy sits at 21.1%. That's a tenant's market. But capturing those advantages requires knowing how to read the signals before you sit down to negotiate.
This guide walks through the market metrics that matter most for startups, a step-by-step analysis framework, NYC neighborhood dynamics that affect both rent and talent access, and how to turn that data into real negotiating leverage.
Key Takeaways
- CRE market analysis evaluates supply, demand, pricing, and economic trends to inform office leasing decisions—not just touring spaces and picking one that looks nice
- Track vacancy rates (Manhattan: 21.1%), net absorption (7.6M SF YTD 2025), asking vs. effective rent spread (15% gap), and construction pipeline (3.54M SF underway)
- Use a structured process: define objectives, gather data, assess supply/demand, analyze comparable leases, then stress test your cost model
- NYC submarkets behave differently—Midtown South (23.9% vacancy) and Midtown (20.0%) call for distinct leasing strategies
- Market knowledge creates negotiating power: in soft markets, push for 1-3 months free rent per lease year, TI allowances above $150/SF, and flexible break clauses
What Is CRE Market Analysis (and Why Startups Need It)?
Commercial real estate market analysis is the systematic evaluation of local market conditions—supply availability, demand trends, pricing dynamics, and economic indicators—to inform leasing or investment decisions. It differs from the standard "tour three spaces and sign" approach most startups follow. A market analysis answers questions like: Is this submarket tightening or loosening? What are comparable tenants actually paying after concessions? How much leverage do I have to negotiate?
The traditional space-shopping approach fails startups in three predictable ways:
- Growth trajectory uncertainty: You're committing to five years of fixed rent without knowing if you'll have 15 or 50 employees in year two
- Limited flexibility: Most commercial leases lock you into multi-year obligations—sign without understanding market direction and you might commit just before landlord concessions increase
- Information asymmetry: Landlords and brokers see transaction data daily; founders see it once every few years
Macro vs. Micro Analysis
Market analysis operates at two levels. Macro analysis examines citywide or national indicators: GDP growth, employment rates, interest rate environments, and overall office market health. These trends set the backdrop. In 2025, Manhattan office leasing reached 31M SF, the highest volume since 2019, signaling market recovery.
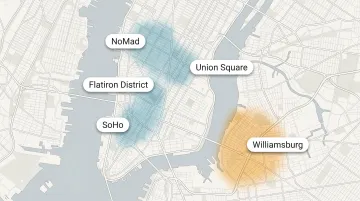
Micro analysis zooms into submarket-specific metrics: vacancy rates in NoMad vs. SoHo, pipeline inventory about to deliver in Williamsburg, rent trends in Flatiron over the past 12 months. This is where day-to-day lease decisions get made. A citywide vacancy rate of 21.1% tells you little if your target neighborhood (Midtown South) shows 23.9% vacancy while another (Midtown) shows 20.0%. Startups need both perspectives, but micro-level data drives actual negotiating strategy.
The Metrics That Drive Smart Office Decisions
Vacancy Rate
Vacancy rate measures the percentage of available commercial space in a given market or submarket. It's the most direct signal of tenant versus landlord leverage. Manhattan's overall vacancy rate stands at 21.1% as of Q4 2025, well above the natural vacancy rate of 8-10% that indicates balanced market conditions.
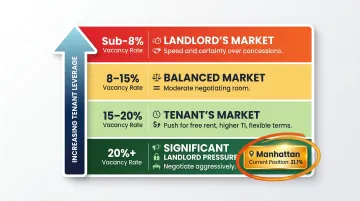
Here's how to read the numbers:
| Vacancy Rate | Market Type | What It Means for Startups |
|---|---|---|
| Sub-8% | Landlord's market | Speed and certainty matter more than concessions |
| 8–15% | Balanced market | Moderate negotiating room; act on strong spaces |
| 15–20% | Tenant's market | Push for free rent, higher TI, flexible terms |
| 20%+ | Significant landlord pressure | Negotiate aggressively; landlords need tenants |
Net Absorption
Net absorption tracks the change in occupied space over time. Positive absorption means space is being leased faster than new supply arrives; negative absorption means more vacancies opening than being filled. Manhattan recorded 7.6M SF of positive net absorption year-to-date through Q4 2025.
Vacancy tells you where the market is. Absorption tells you where it's going. A market at 20% vacancy with strong positive absorption is tightening — move quickly. A market at 15% vacancy with negative absorption is still loosening, so waiting often yields better terms.
Asking Rent vs. Effective Rent
Asking rent is the headline price per square foot landlords advertise. Effective rent is what tenants actually pay after factoring in concessions like free rent periods and TI allowances. According to Crain's reporting on Savills data, Manhattan's asking rent averaged $83.15/SF while effective rent was $70.68/SF — a 15% spread.
In soft markets, this gap widens further. Startups who negotiate based on asking rent alone leave tens of thousands on the table. A 5,000 SF lease at $80/SF asking with $65/SF effective rent after concessions saves $75,000 annually.
Development Pipeline and New Supply
Track planned and under-construction projects to forecast future supply changes. Manhattan has 3.54M SF under construction, with 3.3M SF completed in 2025. Heavy pipeline activity in a neighborhood signals potential vacancy increases and rent softening 12-24 months out, shifting leverage toward tenants.
Cap Rates as Market Health Signal
Capitalization rates (net operating income divided by property value) aren't a direct leasing metric, but they signal investor sentiment and landlord financial pressure. When cap rates compress and landlords carry high leverage, they may push harder on rent. When asset values are uncertain, landlords become more willing to negotiate. Before entering serious negotiations, ask your broker what cap rate environment your target building is operating in — it shapes how much flexibility the landlord actually has.
How to Conduct a CRE Market Analysis: Step-by-Step
Step 1: Define Your Objectives and Parameters
Before pulling data, establish what you're actually analyzing. Three parameters shape everything downstream:
- Target neighborhoods — prioritize talent access, commute patterns, and budget
- Square footage range — use a 12-18 month headcount forecast (25-30 employees typically need 3,000-5,000 SF)
- Lease term flexibility — can you commit to five years, or do you need expansion options?
Account for growth uncertainty. If you're pre-Series A with 12 people today but projecting 25 in 18 months, build buffer space or negotiate expansion rights. The analysis framework changes dramatically between "we need exactly 3,000 SF" and "we need 3,000 SF with room to grow to 6,000."
Step 2: Gather Data from Reliable Sources
Use credible sources for market data:
- U.S. Census Bureau and Bureau of Labor Statistics for demographic and employment trends
- CoStar, RealPage, or institutional reports (CBRE, JLL, Cushman & Wakefield) for vacancy, absorption, and rent data
- Local brokers for hyper-local comparable lease data
Free sources provide a foundation but often lag by 30-90 days. Institutional-grade platforms offer current, granular data — and brokers with active NYC deal flow, like Nomad Group's team across Flatiron, NoMad, and SoHo, carry real-time comp data that public databases simply don't publish.
Step 3: Assess Supply and Demand Dynamics
Interpret the data systematically. Compare current vacancy and absorption against 12-month trends. Is the submarket tightening (falling vacancy, rising absorption) or loosening (rising vacancy, falling absorption)?
Examine the construction pipeline for upcoming supply. Cross-reference with employment growth in your target industries. Tech employment growth in NYC, combined with 31M SF of Manhattan leasing in 2025, suggests strong demand—but that doesn't mean every submarket benefits equally.
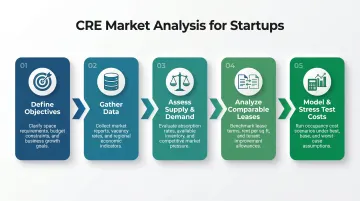
Step 4: Analyze Comparable Leases
Pull recently signed leases in your target neighborhood for similar square footage and building class. Note price per square foot, TI allowance, free rent periods, and lease term.
This reveals actual transaction prices, not listing prices. If asking rents show $80/SF but comps transact at $68/SF effective after 12 months free rent and $150/SF TI, you know where to anchor negotiations.
Step 5: Model Costs and Stress Test Assumptions
Build an occupancy cost model covering:
- Total rent over the full lease term
- Estimated TI spend and buildout costs (plan for 60-90 days with an experienced construction partner)
- Operating expenses including utilities, cleaning, and service charges
Then stress test against the scenarios most likely to derail a startup lease:
- 10-15% rent growth at renewal
- Early sublease need due to a pivot or downturn
- Delayed headcount growth leaving you paying for excess space
If a market only pencils out under perfect conditions, it's not the right market.
NYC Market Intelligence: Reading the Market Like a Local
New York City's commercial real estate market isn't monolithic—it's a collection of distinct submarkets with independent vacancy rates, rent trajectories, and tenant profiles. A macro statement like "NYC office occupancy is recovering" can be true citywide while misleading for specific neighborhoods.
Cushman & Wakefield's Q4 2025 data shows Midtown vacancy at 20.0%, Midtown South at 23.9%, and Downtown at 22.2%. These differences create distinct negotiating positions.
Primary Startup Corridors
NYC's startup ecosystem clusters in specific neighborhoods, each with distinct characteristics:
- NoMad and Flatiron draw tech and fintech companies with strong talent density; asking rents run $70-85/SF with high-quality inventory and peer company networks
- SoHo attracts creative and media tenants to character-rich buildings, with asking rents in the $65-80/SF range
- Williamsburg runs 40% below Manhattan Class A rents and connects directly to an emerging talent pool—Brooklyn's fastest-growing tech corridor
- Union Square anchors the corridor connecting Flatiron to Lower Manhattan, with some of the best multi-line transit access in the city
Beyond-Price Neighborhood Evaluation
Evaluate submarkets on multiple dimensions beyond headline rent:
- Transit access to 4/5/6, N/Q/R/W, and L trains (Flatiron, Union Square) directly affects how wide a talent net you can cast
- Proximity to NYU, Columbia, and established tech clusters accelerates hiring velocity
- Walkable amenities—coffee shops, gyms, restaurants—affect employee retention and daily culture
- Co-locating with peer companies generates referrals, informal partnerships, and recruiting networks
Nomad Group has leased over 2 million square feet across these corridors, which means landlord relationships and lease comp data that don't appear in public databases—a real advantage when you're negotiating your first NYC office.
Reading Neighborhood Trajectory
Assess neighborhoods directionally, not just as snapshots. Falling vacancies and rising absorption signal early appreciation—favorable timing for long-term leases. New supply flooding a submarket creates short-term concessions, but sets up rent pressure down the road.
Use 3-5 year trend data alongside current figures. Midtown South's 23.9% vacancy looks like opportunity—but whether that number is falling or rising quarter-over-quarter tells you how motivated landlords will be six months from now, which is what actually matters at the negotiating table.
From Analysis to Lease Negotiation Leverage
Vacancy data translates directly to negotiating power. In submarkets with elevated vacancy, landlords compete aggressively. Free rent averaged 14.4 months for new Manhattan leases in early 2026, while TI allowances averaged $150.51/SF. Startups who arrive with data have fundamentally different conversations than those relying on landlord pitches.
Tenant's Market vs. Landlord's Market
Identify which market you're operating in using the metrics covered earlier:
- Tenant's market (vacancy >15%, negative or low absorption): Push for longer free rent (2-3 months per lease year), above-market TI ($175-200/SF), flexible break clauses, and expansion rights
- Landlord's market (vacancy <10%, strong positive absorption): Emphasize speed and certainty over maximum concessions. Prepare to move quickly on attractive spaces
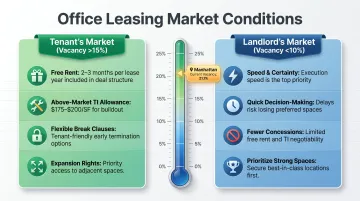
Manhattan's current 21.1% vacancy firmly establishes a tenant's market. Use that leverage.
Working with Full-Service Partners
Knowing the data is one thing — knowing the landlords is another. Startups benefit from partners with existing relationships in the buildings they're targeting. Nomad Group works across the full leasing lifecycle — brokerage, lease negotiation, construction, and facilities management — so the same team that finds your space also builds it out and manages it day-to-day. Their direct relationships with landlords across NoMad, Flatiron, SoHo, and Williamsburg give startups transaction visibility and credibility that's hard to replicate without years in the market.
Common Mistakes Startups Make When Analyzing the CRE Market
Common Mistakes Startups Make When Analyzing the CRE Market
Relying on Outdated or Oversimplified Data
Using market reports 12+ months old or applying citywide averages to submarket-specific decisions leads to mispriced deals. Markets shift quarter-over-quarter. Manhattan's Q4 2025 data shows sharp submarket variation—Midtown South's 23.9% vacancy versus Midtown's 20.0% requires different strategies. Verify data across multiple sources and prioritize recency.
Ignoring Qualitative Signals Alongside Numbers
Market analysis isn't purely quantitative. Several leading indicators won't show up in vacancy data yet:
- Increasing broker activity in a neighborhood
- Major anchor tenant commitments (like tech companies expanding into Brooklyn)
- New transit infrastructure investments
Combine hard data with on-the-ground observation and broker intelligence for a complete picture.
Frequently Asked Questions
What is the current market trend for commercial real estate?
Industrial remains strong, office is stabilizing in select submarkets (particularly tech-heavy corridors like Midtown South and Brooklyn), retail is steady, and multifamily has seen overbuilding in some markets. National trends don't always reflect local realities—track submarket-specific data for an accurate picture.
What are some examples of market analysis in commercial real estate?
Vacancy and absorption analysis of a target submarket before signing a lease; comparable lease analysis (comps) to benchmark rent per square foot; demographic and employment trend study to evaluate long-term neighborhood demand.
What is a competitive market analysis in real estate?
A CMA compares a specific property to recently leased or sold comparables in the same area to assess whether asking price or rent is reasonable. It factors in square footage, location, building class, amenities, and recent transaction history.
How do vacancy rates affect commercial lease negotiations?
Higher vacancy rates signal a tenant's market, giving tenants leverage to negotiate concessions like free rent, TI allowances, and flexible lease terms. Lower vacancy rates indicate a competitive market where landlords have more pricing power and tenants need to move quickly.
What NYC neighborhoods are best for startup office space?
NoMad, Flatiron, SoHo, Williamsburg, and Union Square are NYC's primary startup corridors, offering transit access, talent density, and peer company networks. Best fit depends on your industry, headcount, and budget—rent and availability vary meaningfully between submarkets.
How often should a startup revisit their commercial real estate market analysis?
Update your analysis at least quarterly when actively searching, and annually during an existing lease. Shifting submarket conditions can open opportunities for subletting, renewal negotiations, or relocation.