For companies actively searching for space, this bifurcation creates genuine opportunity — if you know where to look.
This guide breaks down where Manhattan rents actually stand by neighborhood and building class, the three trends reshaping how companies lease space, and what the near-term market trajectory means for decisions you're making right now.
Key Takeaways
- Manhattan's overall average asking rent reached $73.19/SF in Q4 2025, with Class A averaging $82.72/SF — trophy properties in Midtown and Hudson Yards routinely exceed $120/SF
- A clear "flight to quality" is bifurcating the market: trophy buildings lease fast while Class B/C properties face rising vacancies and falling rents
- Tenants hold real leverage in Class B buildings, where TI allowances and free rent periods remain near historic highs
- Neighborhood pricing ranges from ~$56/SF in the Financial District to $130+/SF in Midtown's Plaza District and Hudson Yards
- Vacancy is beginning to tighten — the window of maximum tenant leverage may be shorter than it appears
Manhattan Office Rent in 2025: Pricing by Neighborhood and Building Class
Current Benchmarks
According to Cushman & Wakefield's Q4 2025 Manhattan Office MarketBeat, the market closed 2025 with these figures:
| Metric | Q4 2025 Asking Rent |
|---|---|
| Manhattan Overall | $73.19/SF |
| Class A | $82.72/SF |
| Class B (2024 baseline) | ~$61.86/SF |
| Class C (2024 baseline) | ~$50.88/SF |
Major brokerages haven't published updated Class B and C figures for Q4 2025, but both tiers continue to face downward rent pressure.
Submarket Breakdown
Neighborhood shapes your rent as much as building class does. Here's where the major submarkets stand:
| Submarket | Overall Asking Rent | Class A Asking Rent | Vacancy |
|---|---|---|---|
| Midtown (Total) | $76.03/SF | $84.98/SF | 20.0% |
| Plaza District/Madison | $103.31/SF | $116.59/SF | 21.0% |
| Hudson Yards/West Side | $70.77/SF | $72.69/SF | 28.6% |
| Flatiron/NoMad/Union Square | $74.27/SF | $98.55/SF | 22.7% |
| Financial District (Downtown) | $56.23/SF | $61.24/SF | 22.2% |
| Times Square South | $52.90/SF | $69.00/SF | 24.0% |
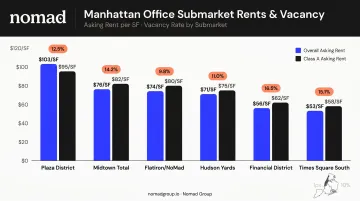
Source: Cushman & Wakefield Q4 2025; Avison Young Q1 2026 separately reports Hudson Yards at $129.45/SF and the Financial District at $64.16/SF — differences reflecting how submarkets are defined.
What Each Submarket Means in Practice
Midtown's Plaza District remains the traditional home of financial services firms, law practices, and corporate HQs that require a prestigious address. Trophy towers like One Vanderbilt have pushed rents well past $200/SF for top floors — One Vanderbilt has sublease space listed at $350/SF, an outlier that signals how far Plaza District ceiling prices have climbed.
Hudson Yards is Manhattan's newest commercial district, built for tech and financial tenants who want state-of-the-art infrastructure. Depending on the source, Class A asking rents range from the low $70s to over $129/SF — the spread reflects significant variation by specific tower and floor.
The Flatiron, NoMad, and Union Square corridor — "Unicorn Lane" — is where high-growth startups and scaling tech companies concentrate. Class A asking rents average around $98/SF, but the range is wide.
Companies like Authentic Insurance, Nirvana, and dbt Labs have landed well-located, high-character spaces here at competitive effective rents.
The Financial District is Manhattan's most affordable submarket for Class A space, with asking rents around $56–64/SF and vacancy rates above 22%. For cost-sensitive tenants, FiDi offers genuine Class A quality at a significant discount — but it requires accepting a different commute profile and neighborhood character.
Trend 1: The Flight to Quality Is Redefining What "Good" Office Space Means
The Numbers Behind the Split
The most consequential shift in Manhattan's office market isn't about overall vacancy — it's about where leasing activity is actually concentrating.
According to a JLL analysis published in January 2026, Manhattan set a new record in 2025 with 313 leases at $100/SF or more, totaling approximately 9.96 million SF. Twenty-eight transactions exceeded $200/SF, and six surpassed $250/SF. For context, the 2024 prior-year record was 212 leases at $100+.
Meanwhile, CBRE data from March 2025 shows that top-tier Class A/A+ office buildings saw base rents up 3.1% and effective rents up 5.2% year-over-year, while lower-tier effective rents fell 1.2%.
Two segments of the same market — moving in opposite directions.
Why Companies Are Paying More
The driver isn't prestige for its own sake. Companies across sectors have increasingly reframed office space as a talent retention and recruitment tool — and the data is backing that instinct.
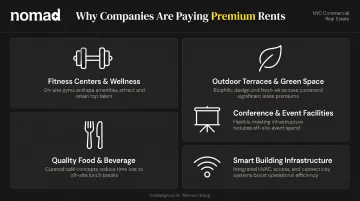
The amenities that now move deals include:
- Fitness centers and wellness facilities
- Outdoor terraces and green space
- Quality food and beverage options on-site
- Conference and event facilities beyond basic meeting rooms
- High-quality air filtration and smart building infrastructure
For scaling companies competing for technical talent in a hybrid environment, a compelling physical workspace has become a genuine differentiator — one that shows up in recruiting conversations and return-to-office participation rates alike.
What's Happening to Class B and C Buildings
The flip side is challenging. Older, lower-amenity buildings are seeing tenants migrate out, and the pipeline of replacement demand at those rent levels is thin.
NYC's office-to-residential conversion market reflects the pressure. Cushman & Wakefield reported that conversion starts reached 4.1 million SF through August 2025, up from 3.3 million SF in all of 2024.
CBRE identified 44 buildings totaling 10 million SF as likely conversion targets — and if all rumored projects complete, roughly 16.5 million SF of existing office stock could be removed from the market.
NYC's M-CORE program (Manhattan Commercial Revitalization) is also incentivizing landlords to renovate pre-2000 buildings south of 59th Street, adding another path for lower-tier properties to compete for quality-seeking tenants. For tenants actively searching, that means the gap between what's available at the top and bottom of the market will likely keep widening through 2025 and into 2026.
Trend 2: Tenant Concessions Are at Historic Levels — Know How to Use Them
The Gap Between Asking Rent and What You Actually Pay
Manhattan's overall vacancy rate hit 21.1% in Q4 2025. That's a landlord's nightmare, not a landlord's market — and it's produced concession packages that bear little resemblance to the headline asking rents in listing databases.
Effective rent is what you'll actually pay — not the figure on the listing. While asking rent reflects the stated annual rate per SF, effective rent accounts for:
- Free rent periods (months of occupancy without rent payment)
- Tenant improvement (TI) allowances applied against build-out costs
- Favorable annual escalation caps over the lease term
When you factor all three, the gap between what landlords advertise and what tenants actually pay can be substantial — particularly in Class B buildings and higher-vacancy submarkets.
What the Concession Market Looks Like in Late 2025
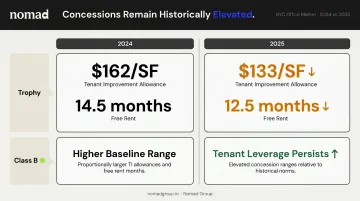
Bisnow reported in November 2025 that even at the trophy end of the Midtown market, concessions have moderated but remain significant:
- TI allowances at trophy properties: averaging ~$133/SF (down from $162/SF in 2024, but still historically elevated)
- Free rent at trophy properties: ~12.5 months (down from 14.5 months in 2024)
- Class B and mid-market buildings: concession packages tend to be proportionally larger relative to rent, since landlords have less demand to rely on
For a company signing a 7-year lease on 5,000 SF, a TI allowance of $133/SF represents $665,000 toward build-out — enough to cover most or all of a full space build-out, rather than leaving you with a bare white box.
How to Actually Use This Leverage
Having the right advisor matters more than most tenants realize. Negotiating base rent down by a dollar or two per SF is far less valuable than structuring a concession package that covers most of your build-out costs and includes 6–12 months of free rent.
For companies in the Flatiron, NoMad, and Union Square corridor, knowing actual build-out costs is what separates a well-negotiated TI package from one that falls short. Nomad Group handles both lease negotiation and construction management in-house — with 300+ completed projects, the team scopes TI requirements against real cost data, not estimates.
That means the concession package you negotiate reflects what the build-out actually costs. Combined with a 90-day build-out turnaround, clients can move quickly when the right opportunity and the right package align.
Trend 3: Flex and Short-Term Office Demand Continues to Rise
Hybrid work isn't going away. The Partnership for New York City reported in March 2025 that 69% of NYC employers have adopted hybrid office policies as their new normal. That reality has permanently altered how companies think about lease commitments.
The two main use cases for flex space in 2025:
- Scaling startups using flex and short-term arrangements to preserve capital before committing to a long-term lease — particularly relevant for seed-to-Series A companies still figuring out how fast they'll grow
- Established enterprises using flexible space for satellite offices, overflow capacity, or project-based teams without modifying their core headquarters lease
The trade-off is straightforward. Flexible arrangements cost more per SF on a monthly basis than traditional leases. But they eliminate upfront build-out costs, furniture procurement, and the risk of being locked into space that no longer fits 36 months later.
Nomad Group's Flex by Nomad service addresses this directly — built on the firm's own in-house infrastructure rather than third-party operators, it avoids the markup that comes with branded coworking chains by controlling the entire service stack in-house.
For companies weighing flex against a traditional lease, the real question isn't cost per SF — it's how much uncertainty you're carrying into the next 24 months.
What's Driving Manhattan Office Rent Trends — and What's Coming Next
The Key Forces at Work
Hybrid and return-to-office policies: The same Partnership for New York City survey found Manhattan office workers present 57% of the time on average weekdays, representing 76% of pre-pandemic attendance. Financial services and law both reported 62% weekday attendance — and major employers in both sectors have issued formal return-to-office mandates. That concentrated demand at the top end of the quality spectrum is exactly what's driving trophy rents higher.
Supply pipeline: As of Q4 2025, Cushman & Wakefield reported approximately 3.5 million SF under construction in Manhattan. That's down from the ~4.6 million SF reported earlier in 2025, as several projects delivered or paused. New Class A supply entering the market is being absorbed — but it's also adding competition for existing trophy buildings.
Conversions reducing lower-tier supply: With 4+ million SF converted or in conversion and another 8.8 million SF proposed, the long-term supply of Class B/C space is gradually shrinking. That matters for the market balance over the next three to five years.
The Near-Term Outlook
Those supply and demand forces are now showing up in the data. Colliers reported that Manhattan availability ended 2025 at 13.9%, marking seven consecutive quarters of stable or tightening conditions. Cushman & Wakefield's Q1 2026 data showed vacancy falling for a seventh straight quarter to 19.9% — the lowest since Q3 2021.
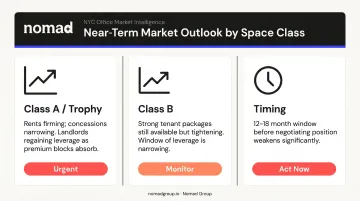
What this means for companies searching now:
- Class A and trophy space: Landlords are already firming on rents and pulling back on concession depth — the window of maximum tenant leverage is narrowing
- Class B space: Strong packages are still available, but that gap will close as overall vacancy continues to tighten
- Timing: Companies ready to commit in 2025 can still capture near-peak concession packages — waiting 12–18 months means negotiating from a weaker position
Frequently Asked Questions
How much is rent per square foot in Manhattan?
Manhattan's overall average asking rent reached $73.19/SF in Q4 2025, with Class A averaging $82.72/SF. Trophy buildings in Midtown's Plaza District and Hudson Yards regularly exceed $115–130/SF, while the Financial District offers Class A space in the $56–64/SF range, the most affordable submarket on the island.
How do you calculate office rent per square foot?
Multiply annual rent per SF by total rentable square footage for your annual base rent, then divide by 12 for monthly cost. A 3,000 SF space at $80/SF costs $240,000/year or $20,000/month. Factor in operating expenses — typically $3.00–3.50/SF for electricity and ~$2.00/SF for cleaning — to understand your true occupancy cost.
What Manhattan neighborhoods have the most affordable office space in 2025?
The Financial District leads with Class A asking rents around $56–64/SF and vacancy above 22%. Times Square South is also competitive at roughly $52–69/SF depending on class. Both submarkets offer real cost advantages over Midtown's Plaza District or Hudson Yards, particularly for companies that don't require a prestige address.
What concessions can tenants negotiate in Manhattan's 2025 office market?
Current conditions support strong concession packages, especially in Class B buildings and higher-vacancy submarkets. TI allowances at trophy properties averaged ~$133/SF as of late 2025, with free rent periods around 12 months — both historically elevated figures. Mid-market and Class B landlords are offering proportionally larger packages to compete.
Is Manhattan office rent going up or down in 2025?
The market is split. Trophy and Class A rents are holding or rising modestly as demand concentrates at the top — record leasing volume at $100+/SF in 2025 confirms that trend. Class B and C rents remain under pressure from elevated vacancy, though the overall average has edged up from 2024 — driven almost entirely by Class A absorption outpacing the rest of the market.