
The consequences are real. Over-leasing ties up capital in empty desks. Under-leasing forces a disruptive mid-growth relocation. Picking the wrong neighborhood costs more in recruiting friction than any rent savings justify. And because commercial leases average around 74 months for new deals, according to Avison Young's analysis of U.S. office lease terms, a bad decision compounds for years.
Startups that win in competitive markets like NYC treat office leasing the same way they treat product decisions: with data. Market pricing, occupancy trends, tenant mix analytics, and neighborhood workforce data replace guesswork with defensible choices.
This article breaks down exactly which data categories matter, how to use them at each stage of an office search, and where startups most commonly go wrong without them.
Key Takeaways
- Real estate data analytics gives startups the same negotiating power that landlords have always had
- Key data categories: submarket pricing, tenant behavior, space utilization, and neighborhood workforce density
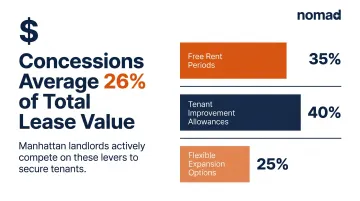
- Concessions (free rent, TI allowances) average 26% of lease value nationally — startups without data leave that on the table
- NYC hard fit-out costs average $212.59 per square foot, and TI allowances typically cover only a portion
- A data-informed broker gives early-stage startups institutional-grade market intelligence — no in-house analytics team required
What Real Estate Data Analytics Actually Means for Startups
Real estate data analytics is the process of collecting and interpreting property-related information — market pricing, occupancy trends, tenant behavior, neighborhood demographics — to make more informed leasing decisions. It's not just for institutional investors. Tenants benefit just as much, often more, because they're the ones signing long-term commitments.
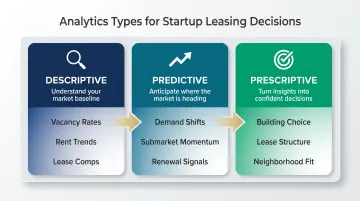
For startups, three types of analytics matter:
- Descriptive: What has happened — vacancy rates, rent trends, historical lease comps in a submarket
- Predictive: What is likely to happen — demand shifts, submarket momentum, lease renewal risk signals
- Prescriptive: What action to take — which building, which lease structure, which neighborhood aligns with growth trajectory
Most of the industry hasn't caught up to that framework yet. A 2025 JLL survey of 1,500+ CRE decision-makers found that while 88–92% of real estate professionals are piloting AI and analytics tools, only 5% achieved all their analytics goals. Data maturity across commercial real estate is still uneven at best.
That gap is an advantage for startups who work with brokers that have already built the analytical layer. It levels the playing field against landlords who've had information advantages for decades.
The Key Data Categories That Drive Smart Leasing Decisions
Submarket and Pricing Data
Submarket data includes availability rates, average asking rents per square foot, rent concession trends (free rent periods, tenant improvement allowances), and lease comps. The difference between using submarket data and ignoring it can be measured directly in dollars.
Manhattan availability tightened from 17.3% in Q1 2025 to 14.6% in Q1 2026, with leasing activity running 41% above the 2020–2024 average. But Manhattan-wide averages mask significant variation. Midtown availability sat at 16.1% in early 2025 with average asking rents of $83.35 per square foot — while Downtown traded at a discount. For a startup deciding between Flatiron, NoMad, and SoHo, the relevant number is neighborhood-level, not borough-level.
Lease comp data is where startups gain real negotiating power. Knowing what a comparable company paid per square foot in the same building — or a competing building across the street — shifts the conversation from "the landlord named a number" to "here's what the market actually supports." Brokers who track comp data at the building level give startups a defined negotiating position backed by evidence.
Concession norms are equally worth tracking. Nationally, concessions average 26% of total lease value according to NAIOP, and Manhattan landlords routinely use free rent and TI allowances to compete for tenants. Startups that don't know the current concession norms in their target submarket are leaving material value unclaimed.
Tenant and Occupancy Behavior Data
Occupancy behavior data covers renewal rates, average tenant tenure, and turnover patterns — and it's one of the most underused signals in the leasing process.
A building with high tenant turnover signals management issues or landlord responsiveness problems — the kind of landlord who's difficult to work with when you need to expand a floor or modify your space mid-lease. Buildings where tenants stay and grow tell the opposite story.
Neighborhood clustering matters too. Concentrations of Series A–B companies in a district signal ecosystem health: shared vendors, talent that knows the area, VC offices nearby, and cultural alignment that affects recruiting. Nomad Group has observed this pattern directly along what the team calls "Unicorn Lane" — the Flatiron, Union Square, and NoMad corridor — where venture-backed startups in fintech, SaaS, and AI have concentrated over time. For a startup focused on hiring and investor access, choosing a neighborhood with the right tenant mix is a strategic decision, not just a real estate one.
Space Utilization and Growth Projection Data
The most expensive leasing mistake startups make is sizing space for today's headcount instead of modeling a range of growth scenarios.
Current benchmarks: average space per person fell to 165 RSF in 2025 (down from 171 RSF the year prior), while target standards for efficient offices land around 132 RSF per person, according to JLL. Global office utilization reached 54% in 2025, meaning most companies are occupying more space than their actual peak usage demands.
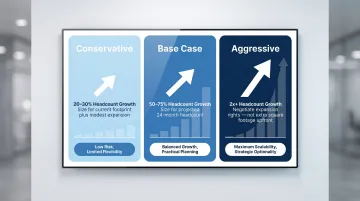
Smart space planning models three scenarios over a 3–5 year lease term:
| Scenario | Headcount Growth | Space Implication |
|---|---|---|
| Conservative | 20–30% growth | Size for current + modest expansion |
| Base case | 50–75% growth | Size for projected 24-month headcount |
| Aggressive | 2x+ growth | Negotiate expansion rights, not extra sq ft upfront |
Building expansion optionality into the lease — right of first refusal on adjacent floors, sublease provisions — is often more cost-effective than signing for space you may never fill.
Using Data at Every Stage of Your Office Search
Site Selection: Finding the Right Neighborhood
Site selection goes well beyond neighborhood preference. Data inputs worth evaluating include:
- Transit proximity: Affects talent recruitment, particularly for engineering roles
- Workforce density: NYC ranks #4 in North America for tech talent, with 360,000+ employed in the tech ecosystem and 467,000 New Yorkers with STEM degrees, per NYCEDC
- Company clustering: Density of similar-stage companies signals ecosystem health
- Amenity scores: Client-meeting venues, restaurants, gyms — factors that affect culture and retention
- Submarket momentum: Rising rents and new co-working openings often signal neighborhoods on the way up
Nomad Group's site selection process draws on 300+ completed tenant buildouts and 2M+ square feet leased across NYC neighborhoods. That volume of on-the-ground experience surfaces the kind of granular neighborhood intelligence — which buildings have strong landlord relationships, where tenant churn is concentrated, which blocks are gaining vs. losing startup density — that no search tool captures on its own.
Lease Negotiation: Using Data to Drive Better Terms
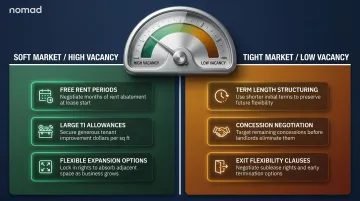
Market data directly improves negotiating position. When vacancy is elevated in a submarket, landlords have more incentive to offer free rent periods, larger TI allowances, and flexible expansion options. When vacancy is low and tightening (as Manhattan's has been into 2026), different levers matter more:
- Free rent periods and TI allowances — primary tools in a soft market
- Term length and concession structure — negotiable even in tight conditions
- Exit flexibility — increasingly important for startups managing uncertain growth timelines
A landlord's own portfolio situation is just as important. A landlord with three vacant floors in the same building is negotiating from a different place than one at 95% occupancy. Brokers who track landlord-level occupancy data can tell a startup when leverage is real versus when the market won't support a particular ask.
Buildout Planning: Data-Informed Design Decisions
Once a space is selected, data informs the buildout. NYC hard fit-out costs average around $212.59 per square foot according to Cushman & Wakefield's 2026 Office Fit Out Cost Guide, with construction cost indices rising 4–5% year-over-year into 2026. Specialty finishes, private office configurations, and upgraded HVAC can push all-in costs meaningfully above that baseline.
TI allowances help, but rarely cover everything. A startup that doesn't benchmark TI against actual construction costs in their target building will underestimate out-of-pocket exposure — sometimes by a wide margin.
Second-generation spaces (already built out by a prior tenant) or turnkey options significantly reduce that gap. Nomad Group's construction management team handles buildouts with a 90-day turnaround, which matters when a startup is managing a tight post-signing timeline and can't afford delays eating into productive occupancy.
Tenant Insights: What Data Reveals About Neighborhood and Building Fit
"Tenant insights" refers to data about who else is leasing in a building or neighborhood — their industry, stage, size, lease terms, and tenure. For a startup evaluating two otherwise comparable spaces, this intelligence answers questions that a walkthrough won't.
Key questions tenant data answers:
- Do high-growth companies stay and expand in this building, or churn frequently?
- Are there competitors nearby that would create recruiting conflicts?
- Does the surrounding company mix support talent spillover and shared vendor networks?
- Is this neighborhood gaining or losing startup density?
Neighborhood demographic and workforce data also informs recruiting decisions directly. Engineering talent in NYC clusters in different areas than creative or marketing talent. A startup choosing between Flatiron and, say, a discounted Downtown option should factor in proximity to the talent pools it actually needs to hire — location affects commute willingness, and commute willingness affects who accepts an offer.
Submarket momentum is a forward-looking signal. Neighborhoods where startup density is rising — evidenced by increasing rents, new VC office openings, and co-working expansions — are worth paying a premium to enter early.
That pattern is visible in Nomad Group's own client portfolio. The concentration of venture-backed companies along the Flatiron/NoMad/Union Square corridor — what they call "Unicorn Lane" — isn't coincidental. It reflects years of tenant-mix data accumulating in a single corridor, reinforcing itself with each new lease.
Building-level data adds the final layer. Landlord responsiveness history, recent capital improvements, and existing tenant profiles help a startup assess whether a landlord will be a genuine partner when they need to expand a floor, negotiate a sublease, or modify space quickly — and for a Series A company on a 3-year lease, that flexibility can matter as much as the rent.
Where Startups Go Wrong Without Data
Signing for the Wrong Amount of Space
The most common and costly mistake: sizing space based on today's headcount, not modeled growth. Locking into 5,000 square feet when you'll need 15,000 in 18 months means a disruptive relocation mid-growth. Signing for 10,000 square feet when the team plateaus means carrying dead rent for years on a 74-month lease.
Both mistakes are avoidable with scenario modeling. The conservative/base/aggressive framework is how a data-informed broker approaches this — building a range of projections, then negotiating lease structure to match the uncertainty rather than betting on a single number.

Treating Rent per Square Foot as the Only Metric
A lower sticker price in the wrong neighborhood can cost more in recruiting friction, employee attrition, and client impression than the savings justify. Poor transit access adds commute burden that candidates price in. Thin talent density means fewer applicants from the surrounding area. A struggling retail base affects the client experience when you're hosting meetings.
The true cost of a lease includes location-dependent factors that only data makes visible. Rent per square foot is one number in a larger equation.
Skipping the Market Intelligence Layer
A startup that negotiates directly with a landlord — or uses a residential-focused agent — removes the data layer entirely. That means no rent comps, no vacancy context, no concession benchmarks, and no insight into who else occupies the building.
Landlords price leases with full market context. A startup walking in without the same data is negotiating blind on a multi-million-dollar, multi-year commitment.
Nomad Group tracks submarket data, landlord portfolios, and tenant mix across NYC neighborhoods — so startups get the full market picture without needing to build an in-house analytics function they don't have the bandwidth to staff at Series A.
Frequently Asked Questions
How is data-driven analytics used in real estate and tenant insights?
Data analytics in real estate draws on market pricing, occupancy trends, tenant behavior, and neighborhood demographics to guide decisions across the leasing lifecycle — from site selection and lease negotiation to buildout planning. It replaces intuition with evidence-backed strategy, giving tenants the same market context that landlords have historically held.
What is the 2% rule for properties?
The 2% rule is a residential investment heuristic suggesting monthly rent should equal at least 2% of a property's purchase price to achieve positive cash flow. It applies to residential investment properties only — commercial office leasing uses entirely different metrics: rent per square foot, TI allowances, vacancy rates, and lease flexibility.
What data should a startup look at before signing an office lease?
Focus on:
- Current submarket vacancy rates
- Rent comp data for comparable spaces
- Landlord concession norms (TI allowances and free rent periods)
- Tenant mix in the building
- Neighborhood workforce and transit data
A data-savvy broker should surface most of this before you tour a single space.
How does neighborhood data affect where a startup should lease office space in NYC?
Neighborhood data — workforce density, transit access, surrounding business ecosystem, and concentration of similar-stage companies — directly impacts recruiting success, team culture, and client perception. Treat it as a strategic input, not an aesthetic one — the right neighborhood actively shapes talent acquisition outcomes.
Can an early-stage startup benefit from real estate data analytics, or is it only for large companies?
Early-stage startups benefit most, because they have the least margin for error. A bad lease at Seed or Series A constrains growth for years. Partnering with an experienced CRE broker who provides market intelligence gives you landlord-grade market intelligence without building an in-house analytics function you don't yet need.