Introduction
Manhattan generates more office leasing activity than any other market in North America — nearly 31 million square feet of new leases closed in 2025 alone, the highest annual volume since 2019. The data is everywhere.
Yet most tenants still negotiate from the same position: a broker's pitch, a quick building tour, and gut instinct about what "feels right." That gap is expensive.
Without market context, tenants sign at asking rents when comps would have supported 15–20% less. They lease 8,000 square feet when 5,500 would have worked. They pick a neighborhood because it sounds exciting, then spend five years locked into a submarket that doesn't serve their talent needs.
This guide gives high-growth companies, startups, and scaling businesses a practical framework for using market data — neighborhood signals, rent comps, vacancy trends — as real leverage at the negotiating table.
Key Takeaways
- Vacancy rates, effective rents, and concession packages reveal what tenants are actually paying — not just asking rents
- Manhattan availability has fallen to its lowest point in four years, shifting some leverage back to landlords in premium Class A space
- Midtown South and NoMad/Flatiron are tightening fast, driven by AI and tech-sector leasing
- Sublease supply is contracting — discounted short-term options are disappearing quickly
- Tenants with buildout cost data and comparable lease data consistently negotiate better lease terms
What "Data-Driven" Actually Means for NYC Office Tenants
Most market data gets created for landlords and investors — cap rates, NOI projections, asset-level returns. Tenants reading those reports are essentially reading the other team's playbook.
Tenant-relevant data looks different:
- Vacancy and availability trends — which submarkets are loosening or tightening
- Effective rent vs. asking rent — what tenants are actually paying after concessions
- Tenant improvement (TI) allowances and free rent months — the real cost of a lease
- Net absorption — whether demand is growing or shrinking in a given neighborhood
- Sublease supply — signals about market health and short-term space opportunities
- Comparable transaction data (comps) — what other tenants in your target building recently negotiated
Each of these metrics tells a different part of the story — and NYC gives you more raw material to work with than almost any other market. Quarterly reports from Cushman & Wakefield, Colliers, Avison Young, and CBRE track Manhattan at the submarket level. CoStar and public lease filings add transaction-level detail. The data exists; the challenge is reading it in context of your company's specific timeline, growth stage, and space needs.
That's where a tenant representative earns their value. Nomad Group, for example, works with high-growth companies across NoMad, Flatiron, SoHo, and Williamsburg — and uses submarket-level comps, real concession data, and absorption trends to build negotiating positions specific to each client's situation. Raw numbers mean little without someone who knows what a Flatiron landlord conceded six months ago, and why that matters to your deal today.
The NYC Office Market Metrics That Actually Matter to Tenants
Vacancy vs. Availability: Know the Difference
These two terms sound interchangeable. They're not.
- Vacancy rate: Space that is physically empty and immediately available
- Availability rate: Broader — includes vacant space plus occupied space being marketed for sublease or future lease
Manhattan's overall availability rate fell to 16.4% in Q2 2025, the lowest in over four years, down 320 basis points year-over-year. Vacancy across key submarkets as of Q4 2025:
| Submarket | Vacancy Rate | Asking Rent (psf) |
|---|---|---|
| Manhattan Overall | 21.1% | $73.19 |
| Midtown | ~21.1% | $78.73 |
| Midtown South | 23.9% | $79.84 |
| Downtown | 22.2% | $56.23 |
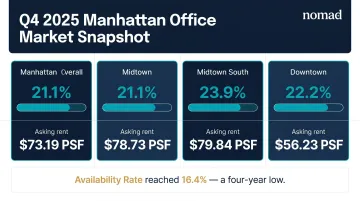
A falling availability rate signals tightening conditions — less negotiating leverage for tenants. Rising availability signals the opposite.
Asking Rent vs. Effective Rent
Headline asking rents are almost never what tenants pay. Effective rent accounts for two major concessions:
- Free rent months: Time at the start of a lease when no rent is owed
- Tenant improvement (TI) allowances: Cash from the landlord toward your buildout
According to Avison Young's Q2 2025 Manhattan report, the gap between Class A base asking rents and net effective rents reached a record $30 per square foot. On a 5,000 SF lease, that's $150,000 in annual value difference.
Over a five-year term, a tenant without this data leaves $750,000 on the table.
TI allowances have moderated from their 2023 peaks but remain roughly 30% above pre-pandemic levels, per CBRE. Current U.S. averages: $87.51 psf overall, with Class A buildings at $92 psf and Class B/C at $73 psf.
Those concession levels are being tested by a market that's absorbing space faster than at any point in recent years.
Absorption Trends and What They Signal
Net absorption measures how much office space the market is absorbing (or shedding) over a period. Positive absorption means more space leased than vacated. Negative means the reverse.
Manhattan posted 7.6 million square feet of positive net absorption for full-year 2025, a multi-year high. Class A properties drove most of that demand. The practical signal: the window of broad tenant-favorable conditions in premium space is narrowing. Downtown and Class B/C inventory still offer more room to negotiate.
The Flight-to-Quality Trade-Off
The post-pandemic bifurcation is widening fast. CBRE data shows that Class A/A+ base rents rose 3.1% since 2023, while Class B/C rents fell 5.7% over the same period. Class A demand represented 81.9% of total Manhattan leasing activity in Q1 2025 — a record quarterly share.
The trade-off tenants must weigh:
- Class A/Trophy: Higher base rents, better amenities, stronger talent attraction, tighter concession packages
- Class B/C: 30-50% lower rents, more negotiating room, but weaker building quality and harder sublease exit if needed
Sublease Supply as a Market Signal
Sublease availability peaked at nearly 22 million square feet during the pandemic. By Q4 2025, it had fallen to 13.5 million square feet, declining for six consecutive quarters. Midtown South sublease inventory hit a five-year low.
For tenants, this matters in two ways:
- Discounted short-term sublease opportunities are contracting fast
- Falling sublease supply reduces a key indicator of tenant-favorable conditions in previously oversupplied submarkets
Reading Neighborhood-Level Data for Your NYC Office Search
Citywide averages tell you almost nothing useful. A company choosing between NoMad, Flatiron, Midtown South, Downtown, or Williamsburg will find dramatically different rent levels, availability pools, transit profiles, and peer-company density.
The Key Signals to Check for Any Target Submarket
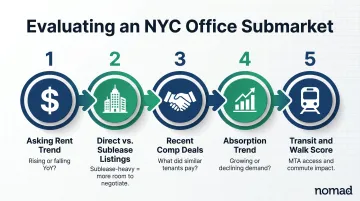
For each neighborhood you're evaluating, examine:
- Average asking rent psf and year-over-year change — Is it rising or falling?
- Direct vs. sublease listings in your target size range — Sublease-heavy submarkets often have more negotiating room
- Recent comparable deals — What did similar tenants actually pay?
- Absorption trend — Growing demand or declining?
- Transit access and Walk Score — MTA ridership recovery data and proximity to major hubs affect employee attendance in hybrid environments
Public databases like CoStar give you a starting point, but they don't tell you which ownership groups actually deliver on tenant experience, which buildings have quirks that affect daily operations, or which landlords will negotiate creatively. That layer of intelligence comes from direct market presence — Nomad Group's work across NoMad, Flatiron, SoHo, Williamsburg, Union Square, and Grand Central gives tenants exactly that kind of ground-level context.
AI and Tech Clustering Is Reshaping Submarket Dynamics
Tech and AI tenants accounted for a third of large new leases in Midtown South during 2024-2025. By early 2026, AI company leasing in NYC had already eclipsed all of 2025's total AI-sector volume. Companies like Tennr, Sierra, Jump Trading, and Clay — which signed a 163,000 SF lease at an SL Green property — all committed to space within that window.
For high-growth tech companies, this clustering data matters beyond just real estate:
- Proximity to peer companies affects talent recruitment and retention
- Being in an established tech corridor signals credibility to candidates and investors
- Neighboring companies create tangible network effects: shared vendors, industry events, and informal talent pipelines
Extend AI chose NoMad at 135 West 29th Street specifically because the space needed to "signal quality and intentionality" to attract top engineering talent. Shortly after moving in, they closed a $17 million Series A. Nomad Group guided that submarket selection — alongside similar decisions for FloraFauna AI and others — based on talent access and where the engineering candidate pool was already concentrating.
Transit and Amenity Density Are Business Decisions
In hybrid environments, every in-office day needs to be worth the commute. Transit accessibility and neighborhood amenity density are quantifiable factors that affect attendance and retention.
- According to MTA 2024 subway ridership data, NYC subways logged 1.195 billion rides last year — reflecting ongoing but incomplete recovery to pre-pandemic levels
- Walk Score and transit proximity can be evaluated for any specific address before committing
- Amenity density — restaurants, fitness, coffee, professional services — directly influences how employees experience the neighborhood, which matters most when you're still building in-office habits into your team's weekly routine
How Tenants Use Data to Negotiate Smarter Leases and Plan Space
Comp Data Is Your Most Powerful Tool
When a tenant can cite specific recent deals — rents, concession packages, lease structures — in the same building or submarket, the landlord cannot use inflated asking prices as an anchor. Comp data reveals:
- What effective rent other tenants actually paid
- How many months of free rent were included
- TI allowance amounts for comparable spaces
- Lease length, renewal options, and termination rights
Comp data is accessible through tenant representation brokers, CoStar, and public lease filings. The challenge is knowing which comps are truly comparable — same submarket, similar size, similar lease term — versus ones that look similar but reflect different market conditions.
Right-Sizing with Utilization Data
Over-leasing is one of the most common and expensive mistakes in NYC commercial real estate. Current benchmarks have shifted significantly from pre-pandemic levels:
- Pre-pandemic average: ~175 rentable square feet (RSF) per person
- 2025 average: ~165 RSF per person (per JLL's 2025 Workplace Benchmark)
- Hybrid model target: 60-120 SF per employee, depending on attendance patterns
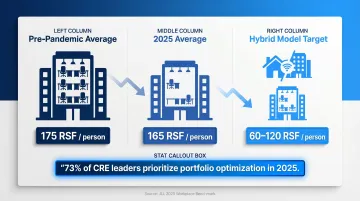
Per JLL's 2025 Occupancy Planning Benchmark Report, 73% of corporate real estate leaders now identify portfolio optimization (not cost-cutting) as their top objective.
CBRE data puts average office utilization rates at 55–65%, meaning most companies are already paying for significant amounts of empty space on any given day.
That data should shape how you lease. Nomad Group's approach: track actual utilization patterns before leasing decisions, survey employees on collaboration needs, and build expansion optionality into leases through right of first refusal on adjacent space and sublease provisions, rather than over-committing upfront.
Buildout Cost Data as Negotiating Leverage
Knowing what a buildout actually costs gives tenants the ability to push back on inadequate TI allowances. Current NYC commercial office buildout cost ranges:
| Finish Level | Cost Range (psf) |
|---|---|
| Basic tenant fit-out | $95 – $140 |
| Standard professional office | $140 – $190 |
| Tech-heavy / high-finish | $190 – $260+ |
| Average total (including furniture and soft costs) | ~$260 |
A tenant who knows a standard buildout runs $140–190 psf can immediately evaluate whether a landlord's TI offer of $75 psf is reasonable, or identify it as a gap worth negotiating. Nomad Group's in-house construction team, with 300+ completed NYC tenant buildouts, provides clients with real, current cost benchmarks that inform TI negotiations directly.
Lease Term Length Should Follow Your Growth Data
Longer leases typically yield better economics: lower effective rents, higher TI allowances. They also create real risk if your headcount trajectory or fundraising timeline makes the space obsolete before the term ends.
Model these variables before choosing a term:
- Headcount growth projection over 3-5 years
- Fundraising timeline and capital availability for expansion
- Hybrid work policy stability (how confident are you in your attendance model?)
Flexible lease structures worth negotiating: shorter initial terms with renewal options, expansion rights on adjacent space, early termination clauses tied to business milestones, and sublease permissions. These provisions cost less to secure before signing than to amend afterward.
Avoiding Costly Missteps: What Happens When Tenants Skip the Data
Signing Above Market Without Knowing It
The most common mistake is paying asking rent in a submarket where the data would have supported a lower effective rate with better concessions. Without comp data, tenants have no reference point, and landlords hold all the information.
The scale of this gap is significant. Manhattan Class A tenants who negotiated effectively in 2025 were capturing roughly $30 per square foot in effective rent discount versus asking rent. On a 4,000 SF lease over five years, that's $600,000 in difference — all of it invisible to a tenant who didn't look at the data.
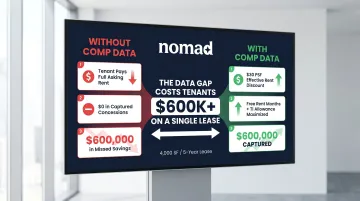
Concessions remain approximately 30% above pre-pandemic levels despite recent declines. Tenants who negotiate with comp data still capture real value — but only if they come to the table with the right numbers.
Choosing a Neighborhood Without Trend Data
Brand appeal and excitement about a neighborhood don't substitute for absorption data. A submarket that feels like the right cultural fit today might be:
- Tightening rapidly — rising rents, falling availability, shrinking concessions
- Overpriced relative to an adjacent submarket offering similar amenities and talent access
- Experiencing structural demand shifts that will change the neighborhood's character over your lease term
Midtown South is a current example: the AI and tech leasing surge is tightening availability quickly. Companies that committed six months ago are in better positions than those who waited for the submarket to "prove itself."
Over-Leasing and Under-Leasing
Both directions carry real costs:
- Over-leasing: Paying for unused square footage, difficulty subleasing excess space when hybrid attendance stabilizes below projections
- Under-leasing: Facing expensive lease amendments, forced relocation, or operational disruption when headcount growth outpaces your space
Right-sizing requires modeling, not guessing. Utilization data, headcount projections, and hybrid attendance patterns can all be quantified before you sign. Nomad Group's space planning process tracks actual utilization over 90 days before making size recommendations — so the number on the lease reflects how your team actually works, not how you think they will.
Frequently Asked Questions
What is data-driven decision-making in real estate?
Data-driven decision-making in real estate means using verified market metrics, comparable transaction data, and trend analysis to guide leasing decisions — rather than relying on a landlord's asking price or marketing materials. In practice, it shifts the negotiation from "what the landlord wants" to "what the market actually supports."
What are the steps of data-driven decision-making in real estate?
- Define the decision and identify which metrics matter
- Collect relevant data (vacancy rates, rents, comps, utilization)
- Analyze trends against your specific timeline and needs
- Apply insights during negotiation or space selection
- Monitor outcomes against your initial projections
What is an example of a data-driven real estate insight?
A tenant discovers through submarket absorption data that availability in their target neighborhood is rising quarter-over-quarter. That rising availability signals tenant-favorable conditions, giving them grounds to negotiate additional free rent months or a higher TI allowance rather than accepting the landlord's initial offer.
What are the 5 C's of data analytics in real estate?
Collection, Cleaning, Correlation, Comprehension, and Communication. Applied to real estate, this means gathering market data, verifying its accuracy, benchmarking it against comparable deals, interpreting it for your situation, and presenting it clearly to drive the leasing decision.
How do NYC office tenants use market data to negotiate better lease terms?
Tenants use comp data, vacancy trends, and buildout cost benchmarks to challenge asking rents, push for more free rent, and secure higher TI allowances. Knowing what comparable tenants in the same submarket recently achieved is where the real leverage comes from.
Which NYC office submarkets are most favorable for tenants right now?
Downtown Manhattan and Class B/C inventory currently offer more negotiating room than Midtown South and trophy Class A corridors, where AI and finance tenant demand is tightening conditions. These dynamics shift quickly — a local market expert can give you current, submarket-specific guidance.