Introduction
Signing a commercial lease in NYC without understanding the market is like navigating Manhattan without a map — costly mistakes are easy to make and hard to undo. For high-growth companies, rushing into office space without proper market research can mean overpaying by 20-30%, locking into unfavorable terms, or choosing a location that doesn't support team collaboration and culture.
Before you tour a single space, you need a clear picture of the market. This guide walks founders and operations leaders through what CRE market research actually involves, the key metrics that matter, how to conduct it step by step, and what's happening right now in the NYC office market.
TLDR:
- CRE market research analyzes supply, demand, pricing, and neighborhood dynamics to inform strategic space decisions
- NYC vacancy fell from 18.2% (early 2024) to 15.5% (Q4 2025), with trophy buildings at just 3.4% availability
- Key metrics include vacancy rates, effective rents (vs. asking rents), building class, supply pipeline, and submarket-level data
- Class A spaces captured 70% of Q4 2025 leasing — despite making up just 58.3% of total inventory
- Begin research 6-9 months before lease expiration to avoid rushed decisions and maximize negotiating leverage
What is Commercial Real Estate Market Research?
Commercial real estate market research is the systematic process of gathering, analyzing, and interpreting data about a target market — including supply and demand dynamics, pricing trends, neighborhood characteristics, and competitive availability — to support strategic space decisions.
For companies seeking office space, CRE market research differs fundamentally from investor-focused analysis. Investors evaluate cap rates, NOI, and asset appreciation potential. Tenants focus on available inventory, comparable lease terms, submarket dynamics, and landlord concessions — the goal is finding the best space at the best terms, not evaluating an asset for returns.
Tenant-focused market research ultimately answers three questions: whether conditions favor tenants or landlords, what leverage exists in negotiation, and which neighborhoods or building classes offer the most opportunity right now.
Primary Data Sources for NYC Office Research
- CoStar Group — transaction-level comps, market analytics, and property data
- CompStak — crowd-sourced lease comps including starting rents, TI allowances, and free rent periods
- CBRE, JLL, Cushman & Wakefield, Colliers, Savills — quarterly reports on vacancy, absorption, rents, and leasing volume
- REBNY — visitation metrics and NYC-specific transaction data
These platforms form the data infrastructure for tenant-side research. That said, much of the most actionable intelligence is proprietary or broker-exclusive, accessible only through relationships built over years of active deal-making in the market.
Key Metrics to Analyze in CRE Market Research
Vacancy Rates and Absorption
Vacancy rate (the percentage of available space not currently occupied) is one of the most important demand indicators. High vacancy favors tenants by increasing options and landlord motivation; low vacancy tightens leverage.
Current NYC market snapshot:
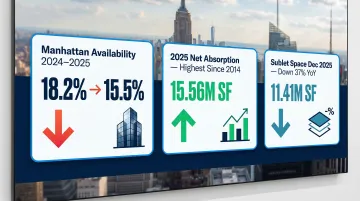
- Overall Manhattan availability dropped from 18.2% in February 2024 to 15.5% in Q4 2025
- Midtown Trophy availability: 3.4% (extremely tight)
- Manhattan recorded 15.56M SF of net absorption in 2025 — the highest since 2014, more than doubling the prior record
Pair vacancy with net absorption data, which tracks whether the market is gaining or losing occupied square footage over time. Manhattan's record 2025 absorption figure means tenants searching now are competing in one of the tightest demand environments in over a decade.
Sublet inventory fell to 11.41M SF by December 2025 (lowest since October 2019, down 37% in 12 months), further tightening available options for tenants.
Asking Rents vs. Effective Rents
Asking rents are what landlords list; effective rents are what tenants actually pay after free rent periods, tenant improvement allowances, and other concessions. In NYC, that gap has historically run into tens of dollars per square foot — making effective rent the number that actually matters for budgeting.
Q1 2025 asking rents by class and submarket:
| Submarket | Class A | Class B |
|---|---|---|
| Manhattan Overall | $85.60/SF | $55.06/SF |
| Midtown | $93.42/SF | $52.83/SF |
| Midtown South | $89.57/SF | $59.12/SF |
| Downtown | $60.56/SF | $53.16/SF |
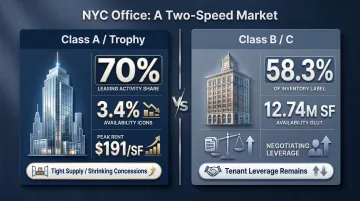
At the premium end, Midtown Trophy buildings commanded $191.02/SF in Q4 2025, up 12.1% quarter-over-quarter.
Concessions are declining from peak but remain elevated:
- Average free rent dropped to 8.9 months in 2024 (down from 9.6 months in 2023)
- Average TI allowance fell to $87.51/SF (down from $97.55/SF)
- Despite the decline, concessions remain approximately 30% above pre-pandemic levels
The effective rent gap between top-tier and lower-tier buildings widened to 6.4 percentage points in 2024, reflecting the split between premium and commodity office space.
Building Class Distinctions
The industry categorizes office buildings by quality, amenities, and location:
- Class A — premium amenities, prime locations, highest rents, modern infrastructure
- Class B — functional, mid-tier, older but well-maintained
- Class C — older stock, lower rents, often requiring updates
NYC is experiencing a pronounced flight to quality. Class A properties captured nearly 70% of Q4 2025 leasing despite representing only 58.3% of inventory. Meanwhile, combined Class B and C availability remained at a "glut" of 12.74M SF at year-end 2025.
The result is a two-speed market: tenants targeting premium space face tight supply and shrinking concessions, while those open to Class B/C buildings retain real negotiating leverage.
Supply Pipeline and New Construction
The Class A tightness isn't just a demand story — it's also a supply story. New construction has been historically constrained post-pandemic, which means the inventory gap at the top of the market isn't filling anytime soon.
NYC's new office construction has been historically low post-pandemic:
- Only 3.5M SF under construction at year-end 2025 (down 33% since 2023)
- 2.14M SF removed from office stock via conversions in 2025
- Major construction headwinds include steel tariffs doubling to 50% and elevated interest rates
The constrained supply pipeline points to continued tightening — especially for quality space — over the next 18–24 months.
Neighborhood-Level Submarket Data
In NYC, market conditions vary dramatically by submarket. What's happening in Midtown may not reflect Flatiron, NoMad, or SoHo. Granular, neighborhood-level data is far more actionable than citywide averages.
Q4 2025 submarket divergence:
| Submarket | Availability | Asking Rent |
|---|---|---|
| Hudson Yards | 6.5% | $135.09/SF |
| Midtown | 14.0% | $82.80/SF |
| Midtown South | 18.4% | $77.50/SF |
| Downtown | 19.9% | $60.43/SF |
| Tribeca | 27.5% | — |
That 21-point spread between Hudson Yards and Tribeca means a tenant using citywide averages to benchmark their search is likely working with the wrong numbers — and could be negotiating from the wrong position entirely.
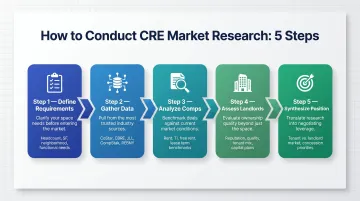
How to Conduct CRE Market Research: Step by Step
Step 1 — Define Your Space Requirements and Target Geography
Research without parameters is noise. Before pulling data, define:
- Headcount needs — current and 12-24 month projections
- Target square footage — typically 150-200 SF per person for modern offices
- Preferred neighborhoods — proximity to talent, transit, clients
- Functional requirements — floor plates, natural light, building infrastructure, amenity expectations
This scope shapes everything that follows and prevents wasting time on irrelevant data.
Step 2 — Gather Data from Credible Sources
Primary sources for NYC CRE data include:
- CoStar, CBRE, JLL, Cushman & Wakefield reports — availability listings, vacancy rates, transaction comps
- CompStak — crowd-sourced lease comps showing actual deal terms
- REBNY — NYC-specific transaction data and visitation metrics
Much of the best data is proprietary or broker-exclusive, which is where a knowledgeable tenant rep becomes invaluable. Brokers have access to off-market opportunities and real-time intelligence that public platforms don't capture.
Step 3 — Analyze Comparable Lease Transactions
Pull comparable leases ("comps") — recent deals at similar sizes in similar buildings within the same submarket. The goal is to benchmark what other tenants actually paid: rent, TI allowances, free rent periods, and lease term length.
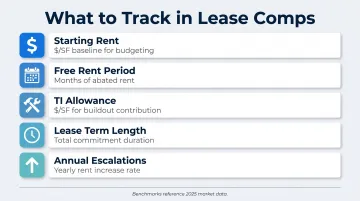
Key comp elements to track:
- Starting rent (per SF)
- Free rent period (months)
- TI allowance ($ per SF)
- Lease term length
- Annual escalations
Top-tier deals in 2025 averaged 16.7 months of free rent and TI allowances of $145.09/SF, though these figures skew toward mega-deals. Smaller tenants typically see 3 months free rent per 5 years of term and TI allowances around $87-100/SF for quality space.
Step 4 — Assess Landlord and Building-Specific Factors
Beyond market-wide data, evaluate:
- Landlord reputation — responsiveness, financial health, renovation history
- Building quality — infrastructure, amenities, tenant experience
- Existing tenant mix — indicator of building positioning and culture fit
- Pending capital improvements — upcoming lobby or system upgrades
- Ownership changes — new ownership often brings fresh capital and flexibility
These qualitative factors directly shape your day-to-day experience in the space and should inform your shortlist.
Step 5 — Synthesize Findings Into a Market Position
Translate raw data into a negotiating framework:
- Determine whether it's a tenant's or landlord's market in your target submarket
- Set a rent budget range based on comps, not asking prices
- Know which concessions to prioritize — free rent, TI, expansion rights, lease flexibility
- Build a list of alternative buildings; credible options are what give you negotiating power
Done well, this step turns weeks of data gathering into a clear negotiating position before you ever sit across from a landlord.
Current NYC Office Market Trends You Need to Know
Flight to Quality is Reshaping Demand
NYC's office market has split into two distinct tiers. Premium Class A buildings — modern amenities, strong infrastructure, desirable locations — are seeing record rents and strong leasing activity. Older, undifferentiated stock is struggling to fill space.
Manhattan signed a record 313 leases at $100+/SF in 2025, with top deals reaching approximately $320/SF at One Vanderbilt. Financial services dominated this segment, accounting for 64% of all $100+ leases.
That split directly affects your search strategy. Premium space is scarce and priced accordingly; mid-tier and lower-quality buildings offer real negotiating leverage if your priorities allow flexibility on finishes and location.
Office Comeback is Gaining Traction in Key NYC Submarkets
Manhattan office leasing hit 42.9M SF in 2025 — the highest since 2014, up 20.1% year-over-year. This is only 2.4% below the 2019 total of 42.97M SF, signaling renewed demand.
Return-to-office momentum is strong in high-growth neighborhoods like Flatiron, NoMad, and SoHo where tech and startup companies are actively leasing. NYC return-to-office metrics reached approximately 86% of 2019 levels — the highest in the nation.
AI firms leased approximately 1M SF in 2025 (+152% year-over-year), with average deal sizes more than doubling from 16,600 SF to 34,500 SF. Midtown South and Hudson Square are absorbing much of this AI, fintech, and enterprise tech activity.
Macroeconomic Headwinds Are Creating Tenant Opportunities
Elevated interest rates, tariff uncertainty, and construction cost pressure have slowed new development, limiting fresh supply. That constraint cuts both ways — tighter supply supports Class A rents, but landlords in older buildings still need tenants and are showing it in their terms.
- Concessions remain 30% above pre-pandemic levels despite recent declines
- Landlords in older, unrenovated buildings are "still willing to aggressively negotiate" on leasing terms
- Class B/C availability glut of 12.74M SF provides options for cost-conscious tenants
If your budget or timeline is flexible, Class B/C availability is your leverage — use it.
Flexible and Shorter-Term Leases Are in Greater Demand
Post-pandemic shifts in work patterns have increased demand for flexible lease structures — shorter initial terms, options to expand or contract, and built-in flexibility.
Lease term trends:
- Small/mid-size tenant median lease terms dropped from 5 to 3 years post-pandemic
- AI startups favor 3-year leases or shorter, with high demand for pre-built "plug-and-play" spaces
- Large tenants diverging: 2025 mega-deal average rebounded to 207.5 months (~17 years)
Landlords are responding by offering flexible expansion and contraction options as alternatives to large upfront cash concessions. Shared amenities — reservable conference rooms, common areas — are now standard ask-for items in most negotiations.
Common Pitfalls to Avoid in CRE Market Research
Relying Solely on Public Data or Listing Platforms
Public databases and listing sites show available inventory but rarely reflect what deals are actually closing at — the true effective rent, concession packages, or off-market opportunities.
Companies that research only through portals often underestimate their negotiating position or miss the best options entirely. A tenant rep broker with active landlord relationships can surface off-market spaces and real-time deal intelligence that no public platform captures.
Conflating Citywide Trends with Submarket Realities
A major mistake is applying macro-level market commentary (e.g., "NYC office is recovering") to a specific submarket search without checking hyperlocal vacancy, supply, and rent data.
In NYC, the gap between submarkets is enormous:
- Availability: 6.5% in Hudson Yards vs. 27.5% in Tribeca
- Asking rents: $48.53/SF to $191.02/SF depending on submarket and building class
Applying citywide averages to a specific search will skew your budget and expectations — sometimes by a factor of 4x. NYC's market is too fragmented for macro-level assumptions to hold at the block level.
Starting Too Late in the Growth Cycle
High-growth companies — especially those scaling headcount rapidly — often begin their market research too late, leaving insufficient time for proper analysis, negotiation, and buildout.
Realistic NYC leasing timeline:
| Phase | Duration |
|---|---|
| Understanding needs & market research | 1-2 weeks |
| Finding tenant rep | 1-2 weeks |
| Touring spaces | 1-4 weeks |
| Negotiating business terms | 1-8 weeks |
| Finalizing lease language | 1-4 weeks |
| Buildout/construction | 1 week to 6 months |
| Total range | 3-4 weeks to 9-12 months |
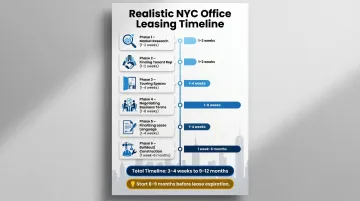
For companies with complex buildout needs or larger square footage requirements, the process typically takes 6-9 months. Starting early protects against rushed decisions and maximizes negotiating leverage.
Turning Research Into Action with the Right CRE Partner
Rigorous CRE market research sets the foundation, but translating data into a winning lease requires execution. A full-service tenant rep team brings together proprietary market intelligence, deep landlord relationships, and on-the-ground neighborhood expertise to convert research insights into favorable lease outcomes.
Nomad Group's end-to-end model means clients don't just get help finding and negotiating a space. The research phase flows directly into execution — no handoffs to unfamiliar vendors, no coordination gaps. That integrated approach is backed by real volume:
- 300+ tenant buildouts completed across NYC
- 2M+ square feet leased in high-demand submarkets
- Coverage across Flatiron, NoMad, SoHo, Union Square, and Williamsburg
The team's hyperlocal expertise, combined with direct landlord relationships, provides access to off-market opportunities and real-time concession intelligence that public databases miss. For clients, that means better lease terms, faster timelines, and spaces built around their long-term headcount plans.
By integrating brokerage, construction, and facilities under one roof, Nomad Group eliminates the friction that slows down traditional real estate processes. Most clients move from signed lease to fully operational space within 90 days. For fast-growing companies on tight timelines, that kind of predictability matters.
Frequently Asked Questions
What is market research in commercial real estate?
CRE market research is the process of gathering and analyzing data on a target market — including vacancy rates, rents, supply trends, and demand drivers — to make informed decisions about leasing, purchasing, or investing in commercial property.
Who prepares a CMA?
Licensed commercial real estate brokers or appraisers prepare a Comparative Market Analysis (CMA). They pull recent comparable transactions and active listings in a target area to estimate fair market value or competitive rent ranges for a given property.
What are the current market trends for commercial real estate?
Key 2025-2026 CRE trends include a flight to quality in office (Class A outperforming), continued strength in industrial and multifamily, and a widening gap between premium and commodity office space. NYC is seeing renewed leasing activity in tech and startup submarkets, driven in part by AI company demand.
How is CRE market research different for tenants versus investors?
Investors focus on cap rates, NOI, asset appreciation, and debt markets. Tenants focus on available inventory, comparable lease terms, submarket dynamics, and landlord concessions — the goal for a tenant is finding the best space at the best terms, not evaluating an asset for returns.
What data sources are used in commercial real estate market research?
Primary sources include CoStar and CBRE/JLL/Cushman & Wakefield market reports for broad data, plus REBNY for NYC-specific transaction data. Broker-proprietary databases add real-time comps and off-market intelligence that public platforms don't capture.
How long does CRE market research typically take for a NYC office search?
Initial market research can be completed in 1-2 weeks, but the full process from research through signed lease and space delivery in NYC typically takes 3-9 months depending on size and complexity — which is why starting early matters for companies on a growth trajectory.